Showing posts with label 2011-2012 Winter Forecast. Show all posts

Saturday, September 8, 2012

Official 2012-2013 Winter Forecast: Midwest

The forecast for the Midwest this winter is varied. In western states, such as Iowa and Minnesota, residents can expect a warmer winter than average, but likely only slightly. The provocation of a negative NAO appears likely, given the incoming El Nino and analogs suggesting such a situation may pan out. That said, the mentioned areas can expect shots of cold air to visit from time to time, but a warmer winter should emerge after all is set and done.
As for eastern sections of the Midwest, like Illinois and Indiana, a negative NAO situation should be able to force Alberta Clippers into the region, followed by cold Canadian air. There are signals from that that these areas may get a bit below average, but that remains to be seen.

Recent drought trends, and an impending El Nino tell me that there is a likelihood of below normal precipitation in areas away from the lake shores. However, this could easily be busted, should a big storm come through the area and drop a foot or two of snow (preferably the latter). Clippers could save this winter, and the -NAO may be able to help, but with the lack of a guarantee on that proposition, I have inserted dry anomalies into portions of the Midwest.

Andrew

Sunday, November 13, 2011

Low Sunspot Activity To Keep US Cool Through Next Several Years

Something we forgot to mention in our final 2011-2012 winter forecast is how the sun will dramatically affect this winter and years to come. That thing we forgot to mention is how low sunspot activity will affect our winter- and it's more than you probably think.
You see, sunspots are areas of intense magnetic activity, leading to the loss of ability to produce convection (rising air, which is how thunderstorms form), therefore creating dark spots on the sun. The sun goes through cycles of high and low sunspot activity, which you can see a history of below.
Basically, when these sunspots are at a low, Europe cools down. It has been noted that, at one point when sunspots were at extremely low levels several hundred years ago, Europe and North America were under very cold winters and an overall colder climate. This extremely low level was called the Maunder Minimum. During this Maunder Minimum, sunspot activity was at levels we have not seen in records since that time. Check out the graph below showing just how low sunspot levels were.
This Maunder Minimum created what is called the 'Little Ice Age', when extremely cold weather settled over Europe.
This winter, solar activity will be at a very low level, one we haven't seen in a while. Essentially, the sun will go into more of a hibernation while going through it's 24th cycle. These cycles are the maximums of sunspots. See the graph below showing the couple most recent sunspot cycles.
We are currently edging up in the new 24th cycle, as you can see in the top image. However, this sun cycle will be weak, so it is expected to max out in sunspot numbers less than what it has in the last couple cycles. This means that the minimum following this upcoming 24th cycle will be even lower than regular minimums should the solar activity remain very low. To confirm this suspicion, let's look at the forecast for this 24th cycle.
You can clearly see in the forecast (red) line of how the maximum number of sunspots will be low- below 100 sunspots, considered a low number for a maximum. So, all this said, what does it all mean? It means that the world will see cooler weather. Global Warming may very well be affected by this low solar activity, and I would not be surprised at all to see global warming take a 'break' for a while. While looking into sunspot forecasts as far out as 2016, we found that the number of sunspots may potentially rival that of the Maunder Minimum. However a 5 year forecast cannot be called accurate, but it is being taken into consideration.

Saturday, October 8, 2011

October 8 Update on La Nina

As of October 8th, the current La Nina is central-based, meaning the coolest temperatures are in the middle of the ENSO monitoring regions. Below is an image of where the ENSO Monitoring regions are.
Putting that together with the current SST (Sea Surface Temperature) Anomalies leads to the conclusion of a central based La Nina with maybe some western-based support. What does this mean right now? Little, if anything. The Nina will continue to change as we work our way into winter. What does this mean for our winter forecast? Nothing- there may have to be some adjustments on the final forecast in Mid-November, but right now we do not feel anything needs to be changed.

Thursday, October 6, 2011

***UPDATED*** 2011-2012 Winter Snowfall Map for Midwest

We are unable to post an explanation at this time due to unforeseen issues. We will try our best to get something out there soon.

Monday, October 3, 2011

2011-2012 Winter Forecast: Active hurricane season in October leads to Active Winter

We have learned from watching a video created by Joe Bastardi that it appears, on a very often occasion, every time there is an active hurricane season in October, the following winter is also very active. We believe this may be due to a long range cycle that sets up in October and continues through the winter. So basically, if you see a strong storm as a result of hurricane season, you can expect that to continue through the winter (most of the time.)

Saturday, September 24, 2011

1st Official 2011-2012 Winter Forecast


See the video briefing here:  http://www.youtube.com/watch?v=XA092WIrVUA
Mentioned by 8NewsWeather in Richmond, Virginia

See updated Midwest Snowfall Map Here: ***UPDATED*** 2011-2012 Winter Snowfall Map for Midwest
See the Official 2011-2012 Winter Storm Track Map and Discussion Here:  NEW: ***OFFICIAL 2011-2012 Winter Storm Track***


Hello everyone, this is the first official 2011-2012 Winter Forecast produced by The Weather Centre. We have decided that this will be an official forecast rather than a 3rd preliminary forecast, as we are investing a higher amount of confidence in this forecast than we would in a preliminary forecast.
Let's take a look at the newly-declared La Nina this year.
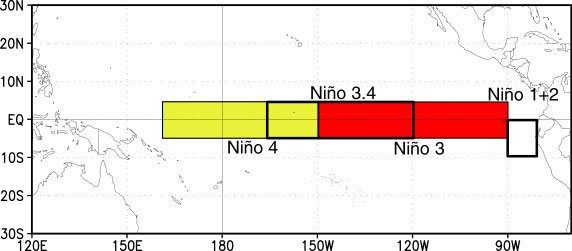
The La Nina is currently East-Based, meaning the lowest temperatures are sourced from the eastern regions of the ENSO areas. To know where the ENSO area is, just look along that horizontal line in the images above- that is within all the Nino regions. Anyways, looking at the SST (Sea surface temperatures), it is very clear a La Nina is in effect on the far eastern side of the ENSO region, with anomalies below -.5 degrees, which is the threshold for a La Nina. The CPC does expect this La Nina to continue and strengthen onwards as we continue through this year.
You might be wondering what all this talk about East Based La Nina is. Below are the temperature effects from West and East Based La Ninas.
The East-Based Nina favors a cooler nation, while West Based La Ninas typically torch the East Coast westwards through into the Plains. Right now, I am expecting this East Based La Nina either to stay where it is, or more likely, spread slightly westward into the center of the ENSO area.
The CPC does make forecasts as well, and they are something we analyzed closely while looking at this forecast. Below is the December-January-February (DJF) forecast for precipitation, then temperatures.

One thing to base anomalies off of is historical information from past Nina's. Below is the raw data for a typical La Nina in terms of temperature and precipitation.


Something else we can forecast for is the NAO, or North Atlantic Oscillation index.
The NAO is basically associated with a permanent low pressure system over Iceland (Icelandic Low) and permanent high pressure system over the Azores (Azores High). These two vary in daily and monthly etc. strengths, and that variation is called the NAO. Below you can see an example of the variations in pressure.

 When the pressure difference (because high pressure has higher pressure and low pressure has lower pressure) is strong, that is a +NAO index. When that difference is lower, that period is called a -NAO index. Below is a graph depicting past NAO index readings.
You can see how the NAO went negative during practically the whole 2010-2011 winter. Recently, the NAO has also been down. When the NAO is negative, it leads to heat waves across the US. You can take a more short-range past look at the NAO below.

All that considered, we can produce a very good forecast for the US. We present to you the 2011-2012 Winter Forecast by The Weather Centre.


 The Ice Threat for this year is in similar areas as to last year, but with a more pronounced threat out west with the potential for a warm winter start across the nation's midsection.

We strongly believe the North US will be very cold, with much of the north half of the US cooler than normal as well. This La Nina will keep the Southern US warm, and, yes, dry. Things will only get worse throughout this winter for the South. The entire Midwest/Northeast/Upper Midwest will get in on above average precipitation. While we cannot pinpoint if all of that will be snow, we are taking the chance that the majority will be snow. The West Coast may have to deal with another wet winter, but we are not entirely sure on that prospect. Portions of the western North Plains will have potential for above average snowfall forecast. This is based on the prospect for clippers this year. We anticipate the North Plains to receive quite a bit of snowfall from these clippers. If the worst case scenario pans out, you will need a new (and bigger) snowblower this winter in the North Plains. Lake Michigan is warm. You know what that means- lake effect snow. Undoubtedly, there will be very heavy amounts of lake effect snow for Michigan, Indiana, and probably Chicago, IL. 
There is something we have to discuss- the Southeast Ridge (SE Ridge). The SE Ridge is an area of high pressure that forms over the Southeast. This ridge of high pressure directs low pressure systems northward towards the Ohio Valley and Great Lakes/Midwest region, in turn giving those places snow. An example of this is the 2011 Feb. 1-3 Groundhog Day Blizzard. This unusually strong storm fired from the South US north and demolished Chicago and places nearby. There is a consensus that this SE Ridge will be stronger than last winter. This would mean the storms having a slightly higher likelihood of going north than south. I do see a potential for 12'' snowfalls (notice the plural) across the Midwest/Ohio Valley/Great Lakes, but I hesitantly say no to another Groundhog Day Blizzard. That was a once in over 20 years storm for the Midwest. This SE Ridge's strength may affect the Northeast's traditional 'Nor Easters', but there will still be the heavy snow, ice and rain for them too. 
Bottom line- this winter will be wild across the Northern tier of the United States. From Chicago to New York, it will get messy. If you haven't already, buy an extra shovel or two for this winter, ESPECIALLY if you live in a lake effect snow-prone area.

Thursday, September 15, 2011

First Official 2011-2012 Winter Forecast Release Date

The official release date for the 2011-2012 first official winter forecast will be SEPTEMBER 24 at 12:00 PM CDT.


A preview of this winter can be described like this:
-Cooler up north,
-Dry down south.

More to come!

Thursday, September 8, 2011

2011-2012 Winter: La Nina Officially Declared

http://www.noaanews.noaa.gov/stories2011/20110908_lanina.html

A La Nina has officially been declared, and here's what's going down.

-Coldest temperatures APPEAR to be in western areas.
-CFS model says this La Nina could be stronger.

Here's current SST (Sea Surface Temperatures)

Monday, August 15, 2011

2011-2012 Winter Forecast: Weekly ENSO Update- August 14-21 2011

The above image is from the trust-worthy ECMWF model ensembles. What we see here is a gradual decline into this winter for ENSO values, indicating a possible La Nina. Values are possible at 0 to -1.5 degrees, but it looks like the general consensus is -.2 to -1. I still anticipate a La Nina to occur this winter.
The CFS model from the Climate Prediction Center indicates values of -.5 to -2.5, but the consensus is down to -1.5, the same strength as last winter's La Nina. This indicates conditions could be similar to last winter, but not the same, as colder conditions are possible than last year.

Friday, August 5, 2011

2011-2012 Winter Forecast: La Nina Watch Issued by CPC

From the CPC


EL NIÑO/SOUTHERN OSCILLATION (ENSO)
DIAGNOSTIC DISCUSSION
issued by
CLIMATE PREDICTION CENTER/NCEP
4 August 2011
 
ENSO Alert System Status: La Niña Watch


Synopsis: ENSO-neutral is expected to continue into the Northern Hemisphere fall 2011, with ENSO-neutral or La Niña equally likely thereafter.
During July 2011, ENSO-neutral was reflected in the overall pattern of small sea surface temperature (SST) anomalies across the equatorial Pacific Ocean (Fig. 1). All of the latest weekly Niño index values were generally near average (Fig. 2), ranging from –0.2oC (Niño-3.4) to 0.5oC (Niño-1+2). However, the subsurface oceanic heat content anomaly (average temperature anomalies in the upper 300m of the ocean, Fig. 3) continued to weaken and is currently near zero, which reflects the strengthening of the below-average temperatures at depth in the east-central Pacific Ocean (Fig. 4). The atmospheric circulation anomalies were more variable during the past month, but the monthly means still reflect aspects of La Niña. For example, convection continued to be enhanced over eastern Indonesia and Papua New Guinea, and generally suppressed over the central equatorial Pacific, mainly south of the equator (Fig. 5). Also, anomalous low-level easterly and upper-level westerly winds persisted over the central tropical Pacific. Thus, while tropical Pacific oceanic anomalies indicate ENSO-neutral, the atmospheric patterns continue to reflect La Niña-like conditions.
The majority of ENSO models, and all multi-model average forecasts (indicated by thicker lines, Fig. 6), indicate ENSO-neutral will continue into the Northern Hemisphere fall 2011 (three-month average in the Niño-3.4 index between –0.5oC and +0.5oC). Beyond the early fall, the forecasts are less certain with half of the models persisting ENSO-neutral conditions continuously through early 2012. Along with a few other models, the latest runs from the NCEP Climate Forecast System (CFS) models predict La Niña to re-develop during the fall (Fig. 7). This forecast is also supported by the ongoing La Niña-like tropical atmosphere, subsurface temperature trends, and the historical tendency for significant wintertime La Niña episodes to be followed by relatively weaker La Niña episodes the following winter. Therefore, ENSO-neutral is expected to continue into the Northern Hemisphere fall 2011, with ENSO-neutral or La Niña equally likely thereafter.
This discussion is a consolidated effort of the National Oceanic and Atmospheric Administration (NOAA), NOAA's National Weather Service, and their funded institutions. Oceanic and atmospheric conditions are updated weekly on the Climate Prediction Center web site (El Niño/La Niña Current Conditions and Expert Discussions). Forecasts for the evolution of El Niño/La Niña are updated monthly in the Forecast Forum section of CPC's Climate Diagnostics Bulletin. The next ENSO Diagnostics Discussion is scheduled for 8 September 2011. To receive an e-mail notification when the monthly ENSO Diagnostic Discussions are released, please send an e-mail message to: ncep.list.enso-update@noaa.gov.

Thursday, July 28, 2011

2011-2012 Winter Forecast: Comparing Last Winter's Underwater Temps to Now

We did some research regarding 1 meter underwater temperatures in the ENSO regions, and decided to compare last winter's temperatures to this year's at current time of publishing.
We can see how cold the water was last year, when there was a strong La Nina in effect. This year, we can see how temperatures in the ENSO regions have decreased by 2 degrees Celsius in a span of 2 or 3 months. This rapid cooling is definitely an encouraging sign that a La Nina may be in the works for this winter.

Thursday, July 21, 2011

Noticeable Cooling in ENSO regions- July 21 ENSO Update

Latest global SST (Sea Surface Temperature)
Data taken from the latest global SST analysis indicates all ENSO regions (outlined in blue) are undergoing a cooling process which could be a sign of another La Nina.
Atmospheric conditions remain telling of La Nina conditions, and in recent weeks, SST and underwater temperatures have been rapidly cooling down.
In weekly animations of the ENSO SST's, it is very noticeable that this cooling has been occurring over the last month, if not more.
As of right now, information has been streaming in, consisting of potential of a West Based La Nina, which would basically torch the East US temperature wise and be the opposite of what we had last year. Obviously, this will be subject to a lot of change, and we will issue more updates as needed.

Saturday, July 16, 2011

2011-2012 Winter Forecast: Nino 3.4 Patterns

Using patterns over the last several years associated with the Nino 3.4 index (the index that determines La Nina/El Nino), we were able to map out 3 examples over the past several years.
All these examples have at least one thing in common:

•La Nina conditions either completely faded away or deteriorated in the summer, then made a resurgence in the winer months.

The years we are looking at are 1996-1997, 2000-2001, and 2008-2009.
Based on those years, I was able to pull up 2 maps for those years- Temperature and Precipitation for DJF (December-January-February).
Temperature Anomalies

Precipitation Anomalies
The North Plains into the Lower Great Lakes were much cooler than normal, and the Lower Great Lakes had slightly above normal precipitation.
The Southeast had below normal precipitation, and slightly warmer temperatures. The Southwest was very warm, as was the Northeast.

What does all this data mean to me?
It is a good indicator of what could come this winter. The above two images are probably the best two indicators of what could happen this winter, so it would be wise to use these as a reference at this time.

Friday, July 15, 2011

2011-2012 Winter Forecast: Eastern ENSO regions cooling down

From The Weather Centre's Headquarters, a special update to the 2011-2012 Winter Forecast is ready to be publicly released.

The above animation is of the SST (Sea Surface Temperature) in the ENSO regions. ENSO regions are the regions monitored to declare a La Nina or El Nino.
The Nino 3.4 region is what meteorologists monitor for the La Nina/El Nino.
Using the above image and the animation at the top of the base, we see the eastern regions of the ENSO areas are beginning a cool down trend that has been evident for at least a month, and noticeable for 2 weeks.
This would be defined as an 'East-Based La Nina'.
An East-Based La Nina would create extremely cold temperatures in the Northern US and around normal precipitation. However, remember that colder temperatures bring about more dry snow. Thus, chances for above normal snowfall would increase.

The big question is if this situation will pan out. We will continue monitoring this closely, so keep up to date on all the information on the right sidebar by clicking on the link named '2011-2012 Winter Forecast'.

Saturday, July 9, 2011

2011-2012 Winter Forecast: MEI June Update

Stay tuned for the next update (by August 6th, or earlier) to see where the MEI will be heading next. La Niña conditions have at least briefly expired in the MEI sense, making ENSO-neutral conditions the safest bet for the next few months. However, a relapse into La Niña conditions is not at all off the table, based on the reasoning I gave in September 2010 - big La Niña events have a strong tendency to re-emerge after 'taking time off' during northern hemispheric summer, as last seen in 2008. I believe the odds for this are still better than 50/50.


The MEI (Multivariate ENSO Index) is an agency that monitors ENSO conditions. The above paragraph is a small portion of what it has published for the June update.
The MEI will be updating again this month soon, and when it does we will be posting the update. 
The reason I have posted this is to recognize the fact that there is scientific evidence by respected scientific officials for a chance of a strong La Nina re-occurring after settling down for the summer.
You can see other 2011-2012 winter forecast posts on the right sidebar.
http://www.esrl.noaa.gov/psd/enso/mei/

Update on 2011-2012 Winter

Thanks to extensive research by a fellow weather enthusiast, it has been determined that the winter of 2011-2012 appears to have probabilities of being similar to the winter of 1995-1996.

Based on that research, I have pulled up some maps regarding the winter of 1995-1996.
Temperature Anomalies of winter of 1995-1996 compared to long term average
Precipitation anomalies for Nov.-Feb. 1995-1996 with regards to long term averages
While unfortunately we cannot superimpose these images together, we are able to determine that the west wing of the US should be warmer than average, with the east portion of the US to be cooler than average, including all of the Great Lakes. The Central Plains could be at an average.
Precipitation wise, a strip of lower precipitation amounts existed from West Kentucky and through Arkansas into Texas. The West Coast was very wet in the winter of 1995-1996, while the Northeast and portions of the Southeast were slightly above average in precipitation.

While details are impossible to figure out this far out, we will provide more data as we receive it. Look on the right sidebar and click '2011-2012 Winter Forecast' tag for all posts regarding that topic.