

Sunday, March 20, 2011


Severe Weather Situation #010
This is Severe Weather Situation #010.
As of 6:41pm CDT on March 20, 2011... Strong storms were redeveloping in North Illinois.
Sunshine succeeding the afternoon storms appears to have warmed the previously cold environment to a point that storms had potential to occur.
A trained weather spotter has indicated cloud to ground lightning is occurring in that area.
Radar is also indicating that the storms may be strong in nature.
People in the counties ALONG THE WISCONSIN/ILLINOIS BORDERS are advised to keep an eye to the sky this evening.
Additionally... short range forecast composite reflectivity indicates showers and storms developing in central Illinois moving north while weakening.
Specific Concerns...
CAPE values ~1000 j/kg
Best Lifted Index ~ -4 degrees
Lapse Rates 6.5-8 degrees
Overall atmospheric instability: Moderately Unstable.
As of 6:41pm CDT on March 20, 2011... Strong storms were redeveloping in North Illinois.
Sunshine succeeding the afternoon storms appears to have warmed the previously cold environment to a point that storms had potential to occur.
A trained weather spotter has indicated cloud to ground lightning is occurring in that area.
Radar is also indicating that the storms may be strong in nature.
People in the counties ALONG THE WISCONSIN/ILLINOIS BORDERS are advised to keep an eye to the sky this evening.
Additionally... short range forecast composite reflectivity indicates showers and storms developing in central Illinois moving north while weakening.
Specific Concerns...
CAPE values ~1000 j/kg
Best Lifted Index ~ -4 degrees
Lapse Rates 6.5-8 degrees
Overall atmospheric instability: Moderately Unstable.
March 20 La Nina Update and Forecast
This is an update and forecast on the La Nina currently occurring.
 This image shows how we are currently in a fairly neutral stage at this time. However, temperatures in this portion of the forecast are projected to drop, then turn towards an El Nino stage.
The next series of images are from a different forecast area in the ocean but still on the basis of ocean temperatures.


 Overall, in these forecast areas, it does appear we are heading for either a neutral state of oceanic temperatures or an El Nino. Tthe latest ensemble members appear to be leaning towards an El Nino, which is especially intriguing since the earliest members prefer a more La Nina term.
We will continue to watch this, but as of now, the official Weather Centre forecast is to head into an EL NINO.
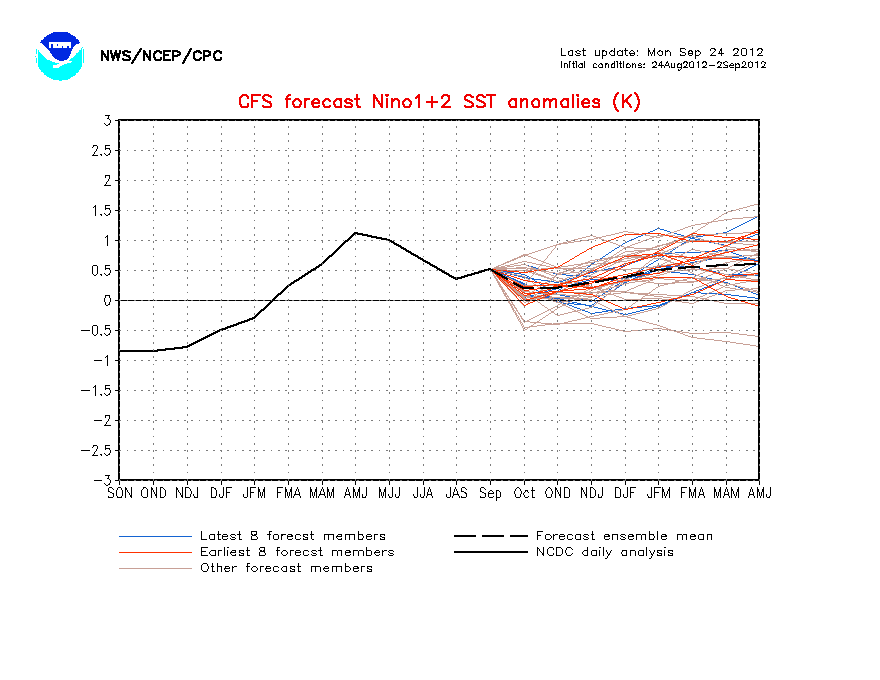
The next series of images are from a different forecast area in the ocean but still on the basis of ocean temperatures.
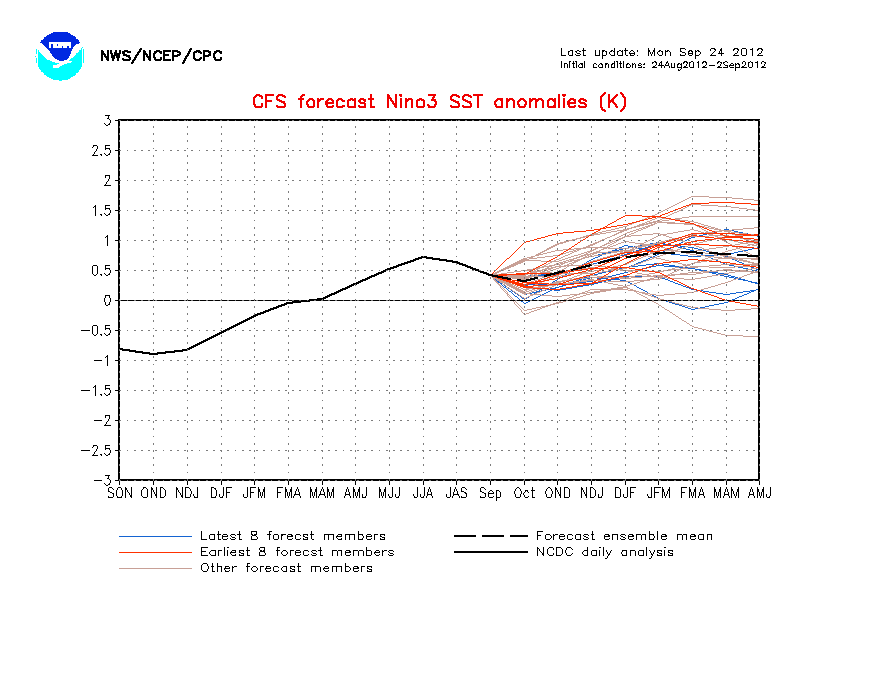
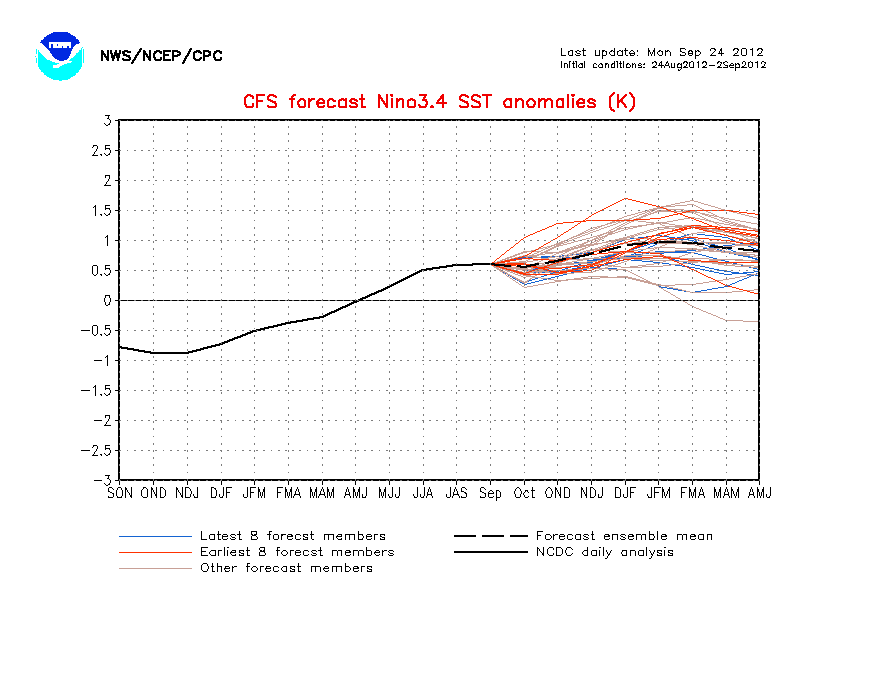
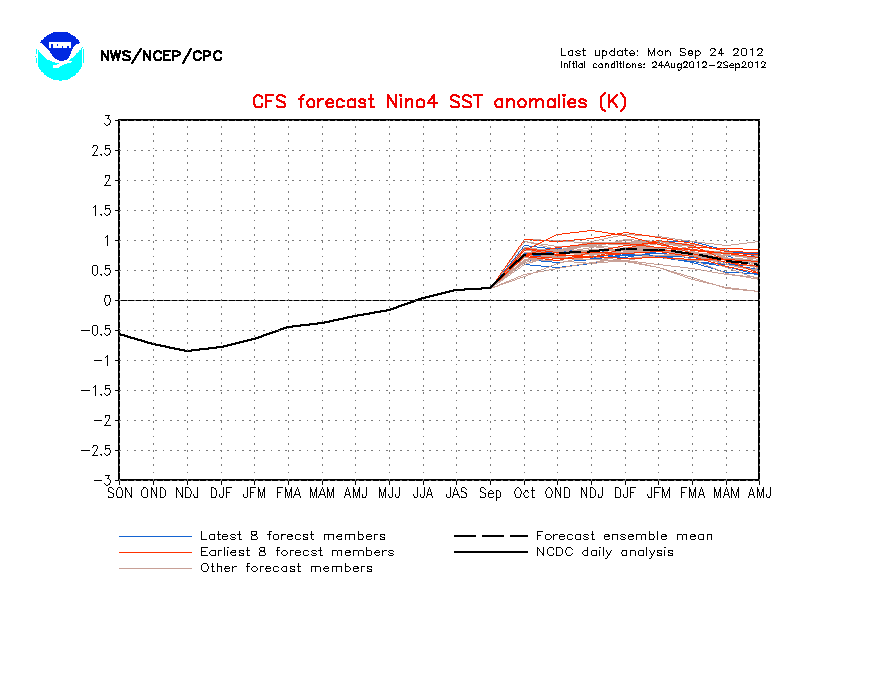
We will continue to watch this, but as of now, the official Weather Centre forecast is to head into an EL NINO.
March 20 Large Severe Weather Potential Forecast Discussion
This is a forecast discussion concerning a potentially large severe weather event Monday into Tuesday.
FORECAST DISCUSSION
The Storm Prediction Center has issued some startling outlooks for the Monday-Tuesday time frame.
Below are the two images.

 The first image is the risk of severe weather on this time frame.
Immediately, we know that, should this develop, it would be a squall line. That would be a very sure thing.
The second image is an image of probabilities of severe weather.
Keep in mind- When there is a 30% risk of severe weather this far out in forecasting severe storms, that 30% area can turn into a MODERATE RISK for severe thunderstorms.
It also appears this will be a 4 day severe weather event: Today, Monday, Tuesday, and Wednesday.
Areas affected Today: Plains into the Midwest.
Areas affected Monday: Plains into the Midwest and a bit in the Ohio Valley.
Areas affected Tuesday: Plains into the south back through much of the Midwest (images above).
Areas affected Wednesday: Ohio Valley.
This has been a forecast discussion. More will be issued on this topic should they be needed.
FORECAST DISCUSSION
The Storm Prediction Center has issued some startling outlooks for the Monday-Tuesday time frame.
Below are the two images.


Immediately, we know that, should this develop, it would be a squall line. That would be a very sure thing.
The second image is an image of probabilities of severe weather.
Keep in mind- When there is a 30% risk of severe weather this far out in forecasting severe storms, that 30% area can turn into a MODERATE RISK for severe thunderstorms.
It also appears this will be a 4 day severe weather event: Today, Monday, Tuesday, and Wednesday.
Areas affected Today: Plains into the Midwest.
Areas affected Monday: Plains into the Midwest and a bit in the Ohio Valley.
Areas affected Tuesday: Plains into the south back through much of the Midwest (images above).
Areas affected Wednesday: Ohio Valley.
This has been a forecast discussion. More will be issued on this topic should they be needed.
March 20 Severe Weather Event Forecast Discussion
This is a forecast discussion concerning a potential for severe weather going into today.
FORECAST DISCUSSION
The RUC model, a very short range model, is indicating the potential for a severe weather event today.
The Best Lifted Index, featured below, is an indicator of instability in the atmosphere. Image from 12z RUC 12 hours out.
 The way BLI (Best Lifted Index) is classified is the following:
Values above 0: Very to marginally stable.
Values 0 to -2: Somewhat unstable, storms unlikely.
Values -2 to -6: Unstable, Storms likely, some severe with lift in the atmosphere.
Values below -6: Extremely unstable, severe storms with lift.
Looking at the image above, some hints I can point out are a potential squall line along the instability line. Another hint is that the strongest storms could exist in the northern areas of this squall line, where there is more BLI.
This squall line, should it develop, would move VERY slowly according to the RUC. That would not be good for people in flooding zones. However, it reduces the chances of tornadoes due to how slow it may be going. At the same time, the squall line is expected to be weakening.
 Next up, we have the same RUC run's depiction of Lapse Rates. The time frame is the same time frame as with the image above.
Lapse Rates are indicators of instability. They show the temperature change with height.
Values less than 5.5 to 6 degrees are considered very stable, while values near 9.5 degrees are considered absolutely unstable.
Taking that information and plugging it in to the forecast shows values of 7.5-8 degrees abundant across the right board, with values reaching 6.5-7.5 degrees on the left image.
Based on that, we can make a prediction that at least moderate instability will exist throughout the predicted area of the squall line.
So this is a potential severe weather situation. Keep in mind these are only predictions. It may develop, it may not. The Weather Centre is only just beginning to shift into severe weather phase.
FORECAST DISCUSSION
The RUC model, a very short range model, is indicating the potential for a severe weather event today.
The Best Lifted Index, featured below, is an indicator of instability in the atmosphere. Image from 12z RUC 12 hours out.

Values above 0: Very to marginally stable.
Values 0 to -2: Somewhat unstable, storms unlikely.
Values -2 to -6: Unstable, Storms likely, some severe with lift in the atmosphere.
Values below -6: Extremely unstable, severe storms with lift.
Looking at the image above, some hints I can point out are a potential squall line along the instability line. Another hint is that the strongest storms could exist in the northern areas of this squall line, where there is more BLI.
This squall line, should it develop, would move VERY slowly according to the RUC. That would not be good for people in flooding zones. However, it reduces the chances of tornadoes due to how slow it may be going. At the same time, the squall line is expected to be weakening.

Lapse Rates are indicators of instability. They show the temperature change with height.
Values less than 5.5 to 6 degrees are considered very stable, while values near 9.5 degrees are considered absolutely unstable.
Taking that information and plugging it in to the forecast shows values of 7.5-8 degrees abundant across the right board, with values reaching 6.5-7.5 degrees on the left image.
Based on that, we can make a prediction that at least moderate instability will exist throughout the predicted area of the squall line.
So this is a potential severe weather situation. Keep in mind these are only predictions. It may develop, it may not. The Weather Centre is only just beginning to shift into severe weather phase.
Subscribe to:
Posts (Atom)