Monday, July 29, 2013

2013-2014 Winter Update: Polar Vortex Likely to be Anomalously Weak This Winter

The polar vortex, a tight low pressure system in the Arctic Circle whose strength determines how much cold air North America may receive in the winter, appears to be headed for a weaker than normal stature this winter.

Two factors are contributing to this new development: the QBO and the stratosphere.

The QBO, also known as the Quasi-Biennial Oscillation, is an atmospheric oscillation that has a positive and negative phase. In the positive phase, a certain wind pattern in the stratosphere enhances the polar vortex, which in turn restricts cold air that may move to North America. On the other hand, the negative QBO permits a weaker polar vortex, resulting in more opportunities for cold weather in the winter.

This image may look a little intimidating, but bear with me, I'll explain it. This chart, developed by Mike Ventrice, shows eight different phases the QBO can take. As is shown on the left and right sides of this diagram, Phases 7, 8, 1 and 2 tend to be associated with the Easterly (Negative) QBO, while Phases 3, 4, 5 and 6 correspond with the Westerly (Positive) QBO. As the chart tells, we are in the mature stage of this positive QBO, something winter weather lovers don't want to see when winter comes around. I posted a few days ago about how the positive QBO is surviving in a very hostile environment, and this should allow the mature +QBO to stay close to the circle in the middle of the chart (this circle indicates the QBO is too weak to be in a certain phase) as it progresses into Phases 6, 7 and 8 by late fall. When November rolls around, I expect the QBO to be transitioning to a negative phase, which will give the green light for a weaker polar vortex.

While the QBO is in kind of a wait-and-see mode for when/if it will move to its Easterly (negative) phase, the current lower stratosphere temperatures are already hinting at a weaker than normal polar vortex this winter.

This image shows past observed temperatures at the 70 millibar level in the stratosphere; considering the stratosphere runs from the 100mb level to the 1mb level, these temperatures are considered to be in the lower stratosphere. Looking at the most recent plot of the red line (observed temperatures), we see it to be above the green dashed line, which defines the average temperature for that time of year. This means the stratosphere is running warmer than normal this summer. A warmer than normal stratosphere in the winter means the polar vortex is favored to be weaker than normal- in the same sense, below normal stratospheric temperatures would favor a stronger than normal polar vortex, and thus fewer opportunities for cold weather in lower latitudes of the northern hemisphere.

When looking at past years with stratospheric temperatures comparable to what we have seen this past spring and into summer, the following years came up:

-2003
-1997

So, I took a look at the winters of 2003-2004 and 1997-1998 in the stratosphere. Both winters had rather significant stratospheric warming events in the early winter, with warmings continuing into the later winter. This bodes well for the idea of a weaker than normal polar vortex this winter.

A new item I found was how the winter stratosphere (December-January-February) tends to reflect stratospheric height anomalies in the summer months (June-July-August).

Analysis of the geopotential height anomalies for the stratosphere from June 1 to July 26 shows a very strong tendency for positive height anomalies over the Northern Hemisphere. The strongest positive anomalies are observed over northeast Asia into Alaska and the Bering Sea. Lower height anomalies are displayed over Greenland and into eastern North America. While this summer to winter stratosphere correlation does not necessarily keep location in mind, the general gist you can get out of this image is that we are likely going to see positive height anomalies (high pressure) battling the polar vortex during the upcoming winter, aiding in the bid to weaken the vortex. If we see these positive height anomalies continue through August, I will be more comfortable with this idea of a weaker polar vortex for the upcoming winter.

The QBO moving from positive to negative (if not neutral-negative), along with an already-favorable stratosphere, tells me the chances of an anomalously weak polar vortex are on the 'likely' side.

Andrew

Sunday, July 28, 2013

Tropical Wave Dorian Attempting to Re-Strengthen

Tropical wave Dorian (now classified as invest 91) is attempting to make a comeback, as overnight developments and new model guidance suggests we are not finished with Dorian just yet.

Satellite imagery above shows a recent sustained burst of convection around Dorian. This convection is evident by the persistent red and orange colors on the satellite loop above. In recent satellite scans, it would appear this convection is weakening, but the fact that this tropical wave has gathered itself after a collapse from tropical storm status is impressive.

A pass from the ASCAT system, which determines wind speed and direction via satellite, has found the tropical wave with a better developed center than what it had about 12 hours ago. This is no major circulation by any means, but it is clear that there is a center associated with Dorian- whether it continues to refine itself is to be determined, but I have little doubt that the increasing convection and better-defined center of circulation spells an impending strengthening of the tropical wave.

Track and intensity guidance has the tropical wave moving northwest in coming days before making a curve north, possibly hitting Florida in the process. The atmospheric flow for this tropical wave is supportive of a track curving north further out to sea, although as of 24 hours ago, the majority of the GFS Ensemble members favored a Gulf of Mexico track. All models pictured here indicate the invest will restrengthen into a tropical storm in just 24 hours, with all but one model projecting hurricane-status strength by the 96 hour mark. The invest will continue to move over relatively warmer waters than what it was over when Dorian had achieved tropical storm status, but it will also be moving through rather substantial shearing.

I think we will see Dorian reform into a tropical storm, but hurricane status is a little out of the realm of reason, in my opinion.

Andrew

Saturday, July 27, 2013

Stratosphere Analysis - July 27, 2013

The 70mb temperatures are, for the first time in many years, well above normal, and have been for some time now. My question is, will this encourage a weaker polar vortex this winter? This brings about the battle between an abnormally warm lower stratosphere and the now-mature positive QBO, which is detrimental to the weakening of the polar vortex. I brought about the very hostile environment this +QBO is currently in a little while ago, but it is managing to survive in this environment. Thus, we must consider the possibility that there will be a +QBO battling this warmer-than-normal stratosphere. If this does happen, I do not believe these two items would cancel each other out- such an occurrence in the synoptic-scale is rather uncommon. 

Which side do I believe will win? The 'good guy' (above average strat temps), or the 'bad guy' (+QBO)? The answer is not nearly as simple as you may want it to be. I think the positive QBO will have undergone serious damage by the time late fall comes around, while the above normal strat temps (barring any significant cooling for the rest of the summer and into the fall) should persist into the winter. While the temps may or may not persist into the winter, I firmly believe the effects of these above normal strat temps we have already seen will come into play for this winter. 

I will have more details on the stratosphere in the near future. Also, this blog will begin to see more heavy-duty weather information like the things above.  I will try to maintain as easy a reading level as possible, but as we enter fall, be prepared to see some hardcore weather posts.

Andrew

Thursday, July 25, 2013

Positive QBO May Not Survive into Winter

The positive QBO we have seen evolve in the past few months appears unlikely to survive into this winter.

The graph above shows the evolution of the Quasi-Biennial Oscillation (QBO) over the past few years, up until the present day. The QBO involves a wind pattern in the stratosphere- in positive QBO winters, the polar vortex is strengthened, and opportunities for cold weather in North America are lowered. In a negative QBO, the wind pattern opposes the polar vortex, leading to additional chances for colder weather. We see more bouts of negative pulses than positive ones on this graph, and the positive QBO waves that do come about are not nearly as strong as the negative pulses. Looking to the far right side of the image, we see a new positive QBO pulse has evolved in recent months. Looking at the far, far right part of the image, we see that the positive QBO has been weakening recently. Could this be a sign that the +QBO pulse is weakening? Will it survive the winter? The first question is a yes (at the moment), while the second question could be a no.

I managed to string together several other atmospheric factors that can help determine the future of this +QBO wave. The first one involves a rather complicated pattern known as the AAM.

This image shows the observed AAM values from August 2012 to the present day. If you look closely, you can see that the AAM trend matches up with the QBO trend. We see negative AAM values from August to roughly November; a quick look at the QBO chart shows negative values were present at that time. Towards the winter months of 2012-2013, we see a definitive positive trend in the AAM, and this occurs around the time the QBO begins its ascent to neutral, and eventually positive territory. Now, with two big negative dips in June and July on the AAM chart, we are starting to see the QBO decrease. Is this correlation a coincidence, or an actual correlation between the two? It's an actual correlation- There is a positive correlation on the order of 0.391 between the AAM and QBO. This means that whatever the AAM does, the QBO tends to do as well, as we showed in this analysis of the two charts. The QBO's trends are also reflected onto the AAM. A value of 0.391 is pretty substantial, compared to other correlations I have seen in different atmospheric patterns, so this should be closely watched.

There's an even more significant correlation that is aiding in the positive QBO dwindling down, and the atmospheric pattern causing this new correlation is the Southern Oscillation Index, or SOI.

This screenshot displays the average SOI values over the past 30 and 90 days- the third box is something we will not discuss here. In the last 30 days, the SOI has averaged out to 8.9, and the last 90 days have brought the SOI to a 7.6 value. A look at any possible correlation between the SOI and QBO reveals a significant negative correlation of -0.521. This negative correlation means that whatever the SOI does, the QBO tends to do the opposite- in this case, the presence of positive SOI anomalies could very well be helping along the weakening of this positive QBO pulse. As I said in the previous correlation, 0.391 is a pretty noticeable correlation; -0.521 is an even bigger correlation, and one that, in my opinion, ought to be driving this fading +QBO pulse. If we want to see the +QBO weaken (which would be good for cold prospects (a negative QBO would be great for cold weather)), I would want to see the positive SOI strengthen to double digits for a prolonged period of time- that would seriously hurt the +QBO pulse.

Our last correlation is not nearly as significant as the previous two, but is another factor assisting in the weakening of the current +QBO phase.

This screenshot shows sea surface temperatures (SST's) in the Nino 1+2 region from now all the way back to August 2012. If you recall, the Nino 1+2 region is located in the waters immediately offshore of western Ecuador. Recently, we have seen very strong below normal SST anomalies in this region, and I decided to see if there was a match between the Nino 1+2 temperatures and the QBO phase. There is a positive correlation of 0.144 between the two. Again, it is not nearly as significant as the other two. However, as the Nino 1+2 region has been so anomalously below normal recently, there must be at least a slight helping by this factor to help weaken the +QBO.

If you're interested, there is a correlation two times stronger than the Nino 1+2/QBO correlation between the Nino 1+2 and AAM. The correlation is a positive one, coming in at 0.282. If the Nino 1+2 region remains negative, it means the AAM will tend to go negative, and that means the QBO will tend to go negative. Likewise, if the AAM goes negative, the Nino 1+2 region's sea surface temperatures will also tend to stay in negative territory.

If these correlations work out, the AAM continues to go negative and the SOI strengthens in its positive phase, the chances of the QBO at least weakening further are rather high.

Andrew

Tropical Storm Dorian Threatening United States

Tropical Storm Dorian has increased the threat of making a landfall on the United States overnight, as computer models suppress the storm to the south in an effort that could draw the system into the Gulf of Mexico.

[Image Removed]

Latest model guidance has a fairly straightforward solution this morning. TS Dorian is favored to continue on a west-northwest path, staying just north of the Caribbean in coming days. As it approaches the waters north of Cuba, some models start to curve the system northward in the beginning stages of what would have Dorian make a u-turn and move back out to sea. However, as many GFS Ensemble members are showing now, some other models hold off on this u-turn plan and continue on a WNW path. This is a new development, and one we need to discuss.

This is the current atmospheric flow chart for TS Dorian. The system is seen just below that big anticyclone of white circles as a small red area in the bottom right corner of the image. If we follow the white lines in and around TS Dorian, we see a WNW track is indeed favored over the next couple of days, as the massive anticyclone to Dorian's north suppresses the system and pushes it along.

This is where things get interesting. On the GFDL model's forecast for the same atmospheric flow level in the image above (valid for July 29), we see Dorian ENE of Cuba, shown as a green and blue swath in this image. But look where the arrows directly west of the green area are pointing: west. Some arrows on the northern fringes of Dorian are going for that u-turn pattern, but the arrows (streamlines) in the center of Dorian are the most influential on its path, and call for a continued WNW movement. If we were to go into the future another 24 hours, we would see that this westward trend continues, and Dorian would be headed for not only Florida, but possibly the Gulf of Mexico.

This all depends on just how the major anticyclone in the second image operates. This continued WNW path would depend on if more anticyclones are able to suppress the storm into taking a Florida or Gulf-bound route, as the above forecast is currently showing.

The two most prevalent tracks I see involve the U-turn idea, where Dorian would curve north and out to sea before hitting Florida, although greatly impacting the Bahamas, and a track where Florida is hit, but not by a direct landfall. Landfall then occurs on any land from Mississippi to the Florida Panhandle, as a u-turn curve pattern takes place. Regardless of the track, the Bahamas will experience tropical activity if the latest forecasts hold up (which I think they will).

Andrew

Wednesday, July 24, 2013

Winter Analog Set Prospers in Summer; Cold Winter Chances Rising

My winter analog set I presented in my preliminary winter forecast a few months back is doing very well at this point in time after success in the summer month of June, and indications are its success will continue into the winter.

I bring up the analogs' success because of recent developments in the past couple of months. Data shows that the Pacific Decadal Oscillation (PDO), a major driver in the seasonal climate around the world (including North America), spiked to positive levels for the first time this year. Previously, we had been in a solid negative PDO state. I did a little research to find other years that had a quick spike to positive PDO values before dropping back to negative territory, like we had in May and June, and I only found one year- 1951. If you recall, the winter of 1951-1952 is one of my two analog years, the other being 1962-1963. To have one of my analog years already accounting for this quick spike to a positive PDO greatly enhances its chances of working out come winter.

Since the analog set has had recent success this summer, let's see what it is telling for this winter.

The mid-level atmospheric pattern for the winters of 1951-1952 and 1962-1963 included low pressure across nearly all of Canada into much of the United States. This depression in heights was extended into the Northeast by the presence of a negative North Atlantic Oscillation, depicted as above normal height anomalies in and just south of Greenland. This negative NAO also assisted in below normal temperatures, which I will show a bit later in this post. Anomalous high pressure was also observed in the Bering Sea, which then enhanced the probability of lower heights in North America. You'll notice these two areas of enhanced above normal heights are positioned in key areas. I already discussed why the Greenland height anomaly was important, but the Bering Sea anomaly is also key to the winter. If we see persistent above normal heights in that region for the winter, it greatly enhances the chances of sudden stratospheric warmings, which can then lead to a dismantling of the polar vortex, and that delivers us into our next subject.

The 50mb level, usually acknowledged as the middle of the stratosphere, is shown to be overtaken by massive above normal height anomalies across the upper latitudes. Typically, one would expect to see the polar vortex over the Arctic Circle, but it has been drastically weakened and forced south into the western North America region. These two large domes of above normal heights tell me the polar vortex did not have an easy time between these two analog years, and if all goes as planned, this winter's polar vortex will not have an easy time either. As I told of in the 500mb paragraph, the Bering Sea high pressure anomaly very well could have played a role, as it typically does with breaking down the polar vortex.

The temperatures for the combined years averaged out below normal across much of the country. One year had above normal temperatures, while the other had very below normal temperatures. When they come together, though, the average is clearly in favor of the below normal. After my recent post about the consistency of the CFS in its winter forecast this summer, I do not doubt the idea of below normal temperatures in the Great Lakes, Plains, Midwest, Ohio Valley, and Northeast. With drought conditions still looming over the Southern Plains, above normal temperatures do not seem that far off of the spectrum of reason. All in all, this analog set is making a reasonable case for this winter at the moment.

Precipitation wise, the average of the two winters was rather dry across the Southern Plains into the Midwest, especially hitting the Pacific Northwest hard. Areas including the Mid-Atlantic and New England areas had limited success in the above normal precipitation department, but the Southwest ended up as the wettest in the nation. An analysis of the two years contrasted greatly, with a very wet Ohio Valley and southern Midwest in 1951-1952, but a very dry Central US for 1962-1963. It is for this reason that I am skeptical about the precipitation idea for this winter. I feel it will not be as dry as this image indicates, but it could end up a tad below normal in portions of the Plains and Midwest. I'll reveal the whole story in my official winter forecast in September.

Overall, I'm feeling very good about the analog set I have going right now. No problems appear to be arising, and I plan on using these same years for my official winter forecast.

Andrew

Tropical Storm Dorian Forms

Tropical Storm Dorian has formed overnight in the eastern Atlantic as a result of the vigorous tropical wave I discussed a few days ago getting its act together at sea.

[Image Removed]

The latest model suite for Dorian has the system placed directly east of St. Lucia in the Caribbean, moving at a generally west-northwest path over coming days. The model guidance above does appear to have a consensus with taking Dorian along the open Atlantic waters towards Hispaniola and Cuba. This is where things get iffy. Some models begin to curve Dorian to the north to allow the system to make a u-turn and move away from the US Mainland and out to sea again. Some other models attempt to push Dorian towards Florida, possibly as a bid for a landfall on the Sunshine State. Still other models (not shown on this image) would appear to want to push Dorian through Cuba and into the Gulf of Mexico, while our last category of models would try to do a re-curve out to sea, but would curve north too late and pose a real landfalling threat to the Carolinas.

The latest depiction of the atmospheric flow for a system of Dorian's strength (1000 millibars or higher) is rather straightforward, but has no model support. Going by this image, Dorian (shown as the 'L' on the bottom right corner of the picture) would go with the flow in a west-northwest pattern, in similar fashion as the model suite. From there, it falls apart. While the atmospheric flow will certainly change in 48 hours, Dorian would likely encounter two options of this overall pattern in the above image were to remain intact:

1) It sees the gap between the two anticyclones in the open Atlantic and pushes through, recurving well out to sea and posing no threat to land.

2) The gap between the anticyclones closes and Dorian is forced south, which could lead to a threat to some northern Caribbean regions, including Hispaniola, Cuba and some other land masses in that area.

As of now, after analyzing the full model suite and some other factors, I would be more inclined to believe the second option, mainly out of both model agreement on a more WNW track over a NW track, and also the tendency for weaker systems to maintain a more westward track.

I bring up the topic of weaker systems because we will see Dorian go through more ups than downs in the next 120 hours. Shown above is a chart of current wind shear values. Dorian is not shown here, but you can see approximately where the system is, shown by a sudden drop in shear values in the bottom right corner of the image.

If we look ahead on this chart and follow the track proposed by the model guidance at the top of this post, we see Dorian heading directly into 40-50 knots of wind shear. That's a lot of wind shear, folks. Dorian will have a very rough time battling this, and we will likely see the system struggle. No matter the track, Dorian is likely to enter that large swath of 40 knots of wind shear extending from the northern fringes of South America well out to the eastern Atlantic.

As of now, I prefer the current model suite in the top image to the extent of when it begins to approach the waters north of Hispaniola. Beyond that time frame, the models become too muddled and uncertainty grows to a point I believe a forecast will be unsuccessful.

Andrew

Tuesday, July 23, 2013

CFS Consistently Showing Cold Winter Ahead

The CFS model has been showing forecasts depicting a cold Eastern US winter for well over a month now, leading to speculation that this model may be on to something.

The CFS model performed well in its prediction for last winter, indicating a likelihood for above normal temperatures across the Northern US in its forecasts roughly a year ago this month. While the winter of 2012-2013 verified with above normal temperatures across the Eastern and Central US, the model did get the gist of a warmer than normal nation for that winter. It appears that this year's forecast shown above for December 2013 (left) and January 2014 (right) may be trying to accomplish the same feat.

I have been doing extensive research and work into items I plan on using for my Official winter forecast. Some of these items are not that favorable for a real winter, while some items do support a chillier winter this year. I will put it all together when the forecast is released this September, but this prolonged trend of a cold winter by the CFS model is something to watch for. I'm not saying it will define my overall forecast, but this cold weather trend will be accounted for in the future.

Andrew

Monday, July 22, 2013

Text Forecast for Invest 98 - July 22, 2013

Invest 98 is currently exiting western Africa as a vigorous tropical wave. This is my current prediction for its track, strength and any other additional variables.

Track
Invest 98 is expected to move generally west-northwest as the atmospheric flow for this wave will allow it to progress in that general direction. An intense area of westward winds is observed in the Caribbean, which may hinder projections of a west-northwestward motion. However, the current model consensus is for the WNW track to verify. The top analog tracks for previous tropical cyclones in the immediate vicinity of Invest 98 show a decisive out to sea solution for this system, where it would move northwest and curve around in the Atlantic in the direction of Europe. Ensemble forecasts agree with this proposal.

Intensity
The lack of entry into the Caribbean indicates this invest will most likely stay below hurricane strength. While I indicated this strength level was possible a few days ago, more recent model forecasts have eliminated that idea. Tropical storm status is certainly attainable for this invest, although the length of time the invest is able to hold the TS title is very much in question.

Landfall potential
The potential of a landfall on the US mainland is low. Any threat of a landfall is greatest in the Mid-Atlantic, which may feel some of the invest's effects as it curves out to sea.

Andrew

Saturday, July 20, 2013

Strong African Tropical Wave Could Develop Into a Hurricane

A strong tropical wave currently over far western Africa has potential to develop into a tropical cyclone in the open Atlantic basin before possibly attaining hurricane status closer to the Caribbean.

Infrared satellite imagery indicates the presence of a vigorous tropical wave over western Africa. Short range GFS model products indicate this tropical wave will push off into the open Atlantic in the next 72-84 hours, before the first signs of development appear. It appears the system fluctuates in strength after development into a rather weak tropical cyclone takes place in the next week or so.

Pushing ahead into the 10-14 day mark, model forecasts develop the tropical system into a stronger tropical storm or a weak hurricane as the cyclone approaches the Caribbean. Previous forecasts from the GFS model take the system anywhere from scraping the Eastern Seaboard to an entrance into the Gulf of Mexico. Based on climatological tracks from where the tropical wave is now, and the current atmospheric flow for tropical waves and/or tropical systems above the 1000 millibar mark, I find the track towards the Gulf of Mexico more likely. A certain caveat is the potential that the atmospheric flow changes drastically, in which case a different track may be favored. But at this point in time, I am hard-pressed to find another track I find more favorable than at least an entry into the eastern Caribbean.

Andrew

Text Forecast for August, 2013

This is a text forecast for the month of August, 2013.

After a heat wave across much of the nation in the middle of the month, it is expected that the month of July will be seen as the more intense month when compared to August.

I anticipate the atmosphere to favor high pressure formation across the West Coast into the Rockies, as a rather strong negative correlation exists between June values of the Antarctic Oscillation (AAO), and mid level height anomalies across the Rockies and the West Coast, and even towards New England and the waters off that area. The AAO ended up negative for the month of June, thus my expectation of high pressure formation across the Rockies.

I do expect periodic instances where the high pressure system in the Rockies will propagate into the Plains and possibly eastward into the Ohio Valley. This probability would rise if the New England area also experiences high pressure growth due to the aforementioned negative correlation. 

The Midwest and portions of the Plains will likely endure multiple cool weather periods, as disturbances drop in from Canada and set up a depression in the jet stream that will offer rather enjoyable temperatures in these regions. The passage of cold fronts through these areas also increases the chance of precipitation across the middle of the nation, so it is not a bad idea to believe these areas have a shot at above average precipitation for the month of August.

Primary severe weather event location is expected to stretch from the Northern Plains to the Midwest, as disturbances riding the jet stream will couple with intermittent cold front passages in the Midwest to highlight these areas for severe weather potential. Tornado numbers are expected to end up below average for the month of August, due to a lack of a highly meridional (very wavy) jet stream and displacement of the highest instability to the south of the main upper level flow. Any tornadoes that do occur would be favored in the Northern Plains, at the peak of the jet stream above the high pressure system in the Rockies.

-Forecast Summary by Region-

Midwest
Precipitation: Above Average
Temperature: Slightly Below Average

Northeast
Precipitation: Slightly Below Average
Temperature: Slightly Above Average

Southeast
Precipitation: Below Average
Temperature: Average

South Central
Precipitation: Average
Temperature: Average

West
Precipitation: Above in north, Below in south
Temperature: Average to Above Average

Andrew

Tuesday, July 16, 2013

Long Term Effects of Coldest Arctic Temperatures Since 1958

Yesterday, I posted about how the Arctic was experiencing the coldest temperatures for this time period since before 1958, as the image below shows. Now that we've clarified the presence of an anomalous cold trend in the Arctic, what could this mean for long term effects into the fall and early winter?

I discussed yesterday how a main effect of these below normal temperatures will be the hampering of Arctic sea ice melt. This means the sea ice extent is most likely going to stay well above the record-breaking low ice we saw last year. What it also means is an increased chance of low pressure formation in and around Greenland, known by many as the positive phase of the North Atlantic Oscillation.

In a study I recently uncovered, it has been detailed that above normal temperatures in the Arctic help lead to exaggerated sea ice. It is this exaggerated loss of sea ice that then leads to the tendency for the negative phase of the North Atlantic Oscillation to develop. The negative NAO involves high pressure formation in or around Greenland that then positions itself over that land mass for a prolonged period of time. In response to the negative NAO, colder air (and rising snow chances in winter) is encouraged to enter the Northeast and East US.

If we begin to see low pressure start to form more often around Greenland entering fall, I would not be surprised to see that the cause of it is this colder than normal Arctic environment. This may pave the way for a fall with generally warmer temperatures and not such a variable flow that would allow for big temperature swings.

It is worth noting that these below normal temperatures appear to be centered in or around the area where these Arctic temperatures are taken. Reanalysis of the month of June shows very slight below normal temperatures across the North Pole, but rather significant above normal temperature anomalies across Northern Canada into the Bering Sea. This will be an interesting factor to watch how the sea ice in those areas responds to the above normal temperatures in June that may continue through this month.

Andrew

Monday, July 15, 2013

Arctic Temperatures Coldest Since 1958

Temperatures being observed at the Arctic are the coldest observed at this time period since at least 1958, leading to additional speculation that this winter could be different than those observed in the past while.

The chart above shows latest temperatures in the Arctic over 2013. The winter is shown at the left of the chart, where you can see the wild fluctuations in temperatures as the stratospheric warmings we discussed in depth last winter aided high pressure development that eventually led to warmer than normal temperatures. However, now that we are in the summertime, the Arctic has calmed down for the season. These unusually cool temperatures can easily be used for those interested in the global warming debate, but I'm not here to discuss that right now.

Arctic sea ice melt is likely to be hampered. Below normal Arctic temperatures, while still above freezing, set the stage for a probable lessening of the severity of ice melt anticipated this summer. While we still expect to fall well below average sea ice levels, it is very possible that this season's sea ice extent will be unlike last year, where we hit a record low in sea ice, but more like sea ice levels roughly a decade ago.

It is likely we will find more correlations between this temperature anomaly and other atmospheric factors later on in the year, but for now, it is something to keep an eye on.

I will have an add-on piece to this article tomorrow.

Andrew

Sunday, July 14, 2013

Multi-Day Severe Weather Event Possible Next Week

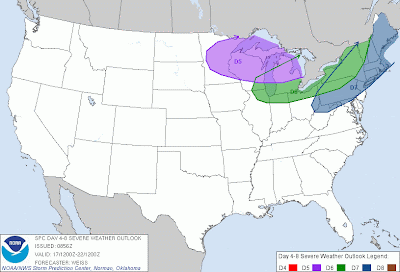
The Storm Prediction Center has outlined three areas of interest in its long range severe weather outlook. Each day is represented by a different color outline and abbreviation; D5 indicates the risk for 4 days out from today will be in that area, D6 indicates 5 days from this day will see the outlined severe weather risk, and D7 means the area outlined in dark blue will see its shot at severe weather in 6 days. The purple area will see severe weather on Thursday, the green area on Friday, and the dark blue area on Saturday. We will break down each day below.

Thursday Severe Weather Risk - Upper Midwest, Great Lakes

Thursday will see the start of this multi-day severe weather event. Surface forecast charts from the Weather Prediction Center show low pressure approaching the region, attached to a warm front/stationary front extending from Minnesota into the central Great Lakes. With a very hot, humid air mass in place as this low pressure system comes through, convective development is expected to begin along the frontal boundary. The first storms, barring any significant changes in coming days to forecast materials, should be individual cells that are hail producers. Any gust fronts or outflow boundaries produced by these first storms may easily fire off other cells in the Wisconsin/Michigan area that will continue to kick start the evening's severe weather activities. Composite reflectivity forecasts to not extend into this time frame just yet, so we will have to believe that these first storms that fire up may very well feed off the excitable atmosphere and quickly become severe.

Friday Severe Weather Risk - Great Lakes, Northeast

On Friday, the severe weather threat shifts east. WPC surface analysis charts see this day evolving with a low pressure system pulling a stationary front east, as a cold front bears down from Canada. Outflow boundaries produced by the thunderstorms on Thursday may very well extend into the Great Lakes and become focal points for thunderstorm initiation. The stationary front behind the low pressure system should act as another area where the first thunderstorms may very well initiate, and it could very well be this reason that the Storm Prediction Center has areas as far west as Chicago in Friday's risk area. As storms fire from the stationary front, it looks like the low pressure system will have a bit of that frontal boundary out ahead of it, which could cover the Great Lakes for thunderstorm development. The cold front pushing down from Canada would then likely provide the ignition for storms in a very hot and humid environment in the Northeast.

Saturday Severe Weather Risk - Northeast, New England

Saturday's situation is a bit less certain than the other two days. The reason for this uncertainty is shown in the WPC forecast graphic above- the cold front from Canada is shown having already pushed through the areas outlined for severe weather that day. Both the Storm Prediction Center and Weather Prediction Center charts will change, but due to the uncertainty at this point, I am not willing to elaborate on this day's set-up.

Andrew

Saturday, July 13, 2013

2013-2014 Winter Update - July, 2013

Many things have changed since I first released my Preliminary Winter forecast a while back, and it's time to make sure we understand what these changes mean for the upcoming winter. For ease of reading, I will break this down into sections.

Section I - PDO Phase Change

The PDO has two phases: positive and negative. In the positive phase, above normal sea surface temperatures preside over the waters immediately offshore the coastline from Alaska down to the Pacific Northwest. In the open northern Pacific waters, a body of below normal sea surface temperatures are observed. It can be thought of as warm water along the coastline surrounding the colder waters in the open northern Pacific. In the negative phase, it's exactly the opposite. Cooler waters are dispatched along the coastline from Anchorage to Seattle, and warmer than normal waters cover much of the northern Pacific.

Until recently, we have been in a negative PDO phase. This meant that precipitation trends during the winter were very dry along most of the Southern US, including the Gulf Coast states. This dry trend continued into the Mid-Atlantic, before very slight above normal precipitation anomalies were favored in the Great Lakes region. The negative PDO tends to favor a very wet West Coast. In the temperature department, a negative phased PDO meant nearly everyone in the nation experienced increased chances above normal temperatures (outside of the Northern Plains, which was favored to experience below normal temperatures).

As of the month of June, the government's official data indicated the month had been rather negative for the PDO. However, the way the sea surface temperature graph above looks, the PDO appears to be trying to get into a phase but is currently not in any decisive motion towards one phase or another. It does look like a negative PDO may try to re-emerge, but right now it is not clearly defined.

Section II: Emergence of two new studies

Recently, I came across two studies that found certain summer/fall patterns in the atmosphere can precede a certain phase of the North Atlantic Oscillation (NAO), a major wintertime oscillation that can determine long term winter weather conditions for the United States and around the world.

The first study involves the idea that summer snow anomalies over the Northern Hemisphere are able to predict the North Atlantic Oscillation (NAO) for winter. It is proposed in this study that summers with high snow content in the northern hemisphere precede winters with a low (negative) NAO index. Likewise, below normal snow cover in the JJA (June/July/August) period precedes a winter with an anomalously high NAO index. Per the latest FSU analysis, June wasn't all that great for snow cover, and July isn't doing much better.


Should we go by this study, we may have to keep an eye out for the tendency of a positive NAO to at least attempt to evolve at some point in the winter. The rest of July and August is yet to be determined for snow cover, but right now, I'm not that bullish on negative NAO prospects.

The second study involves the theory that a certain sea surface temperature (SST) pattern in the fall can precede a certain phase of the NAO. The study indicates a horseshoe pattern in the central and northern Atlantic will develop in the fall and indicate what the NAO may do in the upcoming winter. For example, if you look at the study's link on Page 4 at the first image under '3. Results', you will see a positive SST horseshoe formation surrounding a body of negative SST anomalies offshore eastern Canada. This set-up would favor a negative NAO in the winter. Likewise, a negative SST horseshoe surrounding a positive SST swath would favor a positive NAO in the winter.


Taking a look at the latest SST chart from July 3, you can barely make out a slight negative SST horseshoe surrounding a very prominent positive SST swath off the coast of New England into Canada. Unfortunately, if this were to continue into fall (I don't see how that massive +SST swath could evaporate by August), it would be another unfortunate sign for the winter, possibly trying to tell us the chances of a positive NAO are rising.

Section III: Bullish Long Range Models

The new long range model suite came out for the month of July in the last week or two, and at least two of these forecasts are very bullish on high pressure forming in the Northern Hemisphere.


The GFDL (top) and NCAR (bottom) models are showing a very broad area of above normal anomalies across portions of the Arctic Circle; the NCAR model puts it right down across much of Canada, while the GFDL just washes over the entire Arctic Circle with a sea of intense positive anomalies at the 200mb level. It should be noted that these two forecasts are definitely on the extreme side of the model spectrum.

More importantly, I took a look at nearly a dozen forecasts for precipitation this winter, and a trend of above normal precipitation was present in the Midwest into portions of the Ohio Valley. A portion of the central Gulf Coast was also included. While all long range forecasts come with a high risk for an incorrect forecast, any trend in any set of models is usually a sign that the trending factor has a higher potential of verifying. The same guideline applies to this situation.

My prognosis on the upcoming winter is more hesitant than when I issued my preliminary winter forecast- since then, the PDO threw a big wrench into the prediction for the upcoming winter, and the newly-discovered summer correlations to winter do not help matters. I remain rather upbeat on prospects for at least slightly below normal temperatures in the East US, while precipitation trends are unclear.

Andrew

Thursday, July 11, 2013

Chantal Splits in Two; Gulf Coast on Alert

Tropical Storm Chantal, which weakened to a tropical wave yesterday, has now split into two tropical waves, one of which will keep the Gulf on its toes.

Analysis of the Gulf of Mexico and Caribbean this morning shows the split of Chantal, with two tropical waves moving through the central Caribbean. Let's break down the two waves individually.

The Northern Wave
The tropical wave in dashed lines is the northern portion of the two. This is considered to be the main part of Chantal's remnants that will likely move north-northwest towards the Southeast coast. Model guidance from statistical models (some global models are no longer tracking Chantal, as she is no longer a tropical cyclone) indicates this northern wave should make landfall as a rain event in the Southeast. Let me emphasize that Chantal's remnants are unlikely to reform and make landfall. Rainy weather is expected across the Southeast, however.


The Southern Wave
The southern portion of the split tropical wave is the one I'm concerned about. Based on the atmospheric flow for this southern wave, which is seen in the image above within the deep orange swath south of Cuba, it looks like this southern wave does have a shot of going into the Gulf of Mexico. If it does go into the Gulf, I don't expect too much in the way of development, but I would be surprised if the wave doesn't at least get more organized. Depending on the environment, tropical depression status may be hard to attain; the main part of Chantal will not be going to the Gulf, meaning this southern wave essentially has to start all over again with forming a tropical cyclone.

Andrew

Wednesday, July 10, 2013

Chantal Collapses Overnight; Gulf Coast Threat Rising

Tropical Storm Chantal had a major collapse overnight last night, as the rather-unfavorable environment took a massive toll on the system.

Overnight, it appears that the storm system turned into an open tropical wave at a certain point, meaning it was no longer a tropical cyclone. This came as a result of just how bad Chantal was looking on satellite at that point. As of this morning, a reconnaissance plane from the National Hurricane Center evaluated Chantel.

This image shows wind barbs from the recon plane's observation, with the barbs colored to illustrate the  associated wind speed. A quick glance from this image would see the strongest winds at around 45 knots in purple on the northern side of the storm, right to the left of the little plane icon.

If you look closely in the center of all of these colorful wind barbs, you will see a few white wind barbs. This illustrates areas of calm or nearly calm winds, which we identify as the center of the storm. I ran over a few of the reports from these white wind barbs, and the average surface pressure from the 4 I looked at was 10104 millibars. That's a very, VERY weak tropical cyclone, folks. It clearly shows just how much Chantal suffered overnight.

There's something else that happened overnight that is more concerning, in my opinion. As Chantal went through her overnight crisis, she did not shift northwest as was expected. Instead, the progressed west. This is not something we want to see happen. If Chantal maintains a westward path, chances are she will go into the Gulf of Mexico. And if Chantal goes into the Gulf of Mexico, we're going to have a big problem.

Analog tracks provided by Wunderground show tracks and strengths of storms that were in the immediate vicinity of where Chantal currently is. One look at this chart and it's apparent that the expectation for Chantal to move east of Florida has changed. As Chantal remains weak, I would expect her to hold a westward track and not be that involved in the northern component that was previously expected by other forecast models. This brings me to believe that we will be dealing with Chantal entering the Gulf of Mexico.

The latest suite of forecast models lost the consensus it had built up earlier. If you recall, nearly all forecast models agreed on Chantal moving just to the east of Florida, possibly impacting the Southeast coast. Now, however, the model guidance has disbanded, likely as a result of the turmoil that Chantal underwent last night. The official NHC track calls for Chantal to hit the tip of Florida as a tropical depression after moving through Cuba. Looking at the latest wind pattern that can very well determine where Chantal will go (image below), this track does appear to be a very possible one. At the same time, however, Chantal has a real chance of moving west some more and going towards the Yucatan Peninsula. Whether she hits that area or moves into the Gulf of Mexico is to be determined, and the possibility of her going to the Yucatan Peninsula is also TBD. It's like the red carpet is being rolled out for Chantal to move towards Florida, but when you're dealing with tropical cyclones, it's important to always expect the unexpected.

Wind pattern associated with Chantal
Andrew

Sunday, July 7, 2013

Pacific Decadal Oscillation Turns Positive

The Pacific Decadal Oscillation (PDO), a major driver of weather patterns, especially in the winter, has turned positive recently.

The PDO has two phases: positive and negative. In the positive phase, above normal sea surface temperatures preside over the waters immediately offshore the coastline from Alaska down to the Pacific Northwest. In the open northern Pacific waters, a body of below normal sea surface temperatures are observed. It can be thought of as warm water along the coastline surrounding the colder waters in the open northern Pacific. In the negative phase, it's exactly the opposite. Cooler waters are dispatched along the coastline from Anchorage to Seattle, and warmer than normal waters cover much of the northern Pacific.

Until recently, we have been in a negative PDO phase. This meant that precipitation trends during the winter were very dry along most of the Southern US, including the Gulf Coast states. This dry trend continued into the Mid-Atlantic, before very slight above normal precipitation anomalies were favored in the Great Lakes region. The negative PDO tends to favor a very wet West Coast. In the temperature department, a negative phased PDO meant nearly everyone in the nation experienced increased chances above normal temperatures (outside of the Northern Plains, which was favored to experience below normal temperatures).

Now that we are entering into a positive PDO that looks like it won't be going away anytime in the next several weeks, let's see what the positive PDO composites for temperature and precipitation look like.


The top image shows precipitation trends in positive PDO years, with the bottom image depicting temperature trends in positive PDO years. For precipitation, the Pacific Northwest joins the southern Ohio Valley in being favored for a drier winter. It is worth noting that those in the Pacific Northwest have much higher chances for drier weather, as the dry anomalies in the southern Ohio Valley are very slight. The Gulf Coast experiences a wetter than normal winter, as does a portion of northern California. Oddly enough, the precipitation composite is very similar to that of the El Nino winter.
In temperatures, much of the southern half of the nation is favored for below normal temperatures in a positive PDO winter. This cool trend stretches from New England into skiing country in Nevada, Utah and Wyoming. The Northern Plains and Upper Midwest are faced with warmer than normal conditions in a positive PDO.

Remember, the Pacific Decadal Oscillation is just one of many factors that go into forecasting in the long range- although this composite may say one precipitation trend is likely, another factor may say the opposite precipitation trend is probable. Don't put all your eggs in one basket; even if you like what the positive PDO typically brings to the US, don't base your whole winter's expectations solely on these two images above.

aNDREW

Invest 95 Encountering Obstacles; Threat to US Still Exists

Invest 95 will have to overcome some obstacles in order to maintain its strength, but the potential for this system to affect the US in one way or another still exists.

Visible satellite imagery shows Invest 95 as the system in the center of the image. This invest isn't all that special right now; convection associated with the system isn't too rambunctious, and no defined circulation has been spotted. Despite the meager visible diagnosis, indications are that winds were previously around the 30-40 MPH range, which could have made a case for calling this system a tropical depression. At this point, though, I don't believe that Invest 95 is active enough to hold the title of tropical depression.

Weatherbell
The latest model guidance suite for Invest 95 seems to have cleaned up a few parts of the forecast and made a general consensus for roughly the next 3-4 days. The general idea is that Invest 95 will most likely move west-northwestward and approach the Dominican Republic in coming days. I am a bit skeptical of the models that take this invest south of the D.R. and Haiti, as it appears the GFS model has been taking this system too far west in nearly all of its last several model runs. For that reason, it appears to be rather likely that this invest will most likely not get too deep into the Gulf of Mexico, if it even goes into that body of water at all. The preferred forecast is to have the invest keep in a track that would scrape the northern coasts of Haiti/D.R. and Cuba- beyond that point, model uncertainty ends the consensus.

Before this invest can even think about affecting land, it will have to jump through a few hoops along the way. The image above shows the quality of air in the waters to the west of northern Africa. As the legend shows, the presence of more reds and pinks indicates drier air, while yellows or the absence of any color depicts less dry air is in the area. Invest 95 is shown in the bottom left-ish corner of this image, just east of the hook formation of dry air. That little arm of dry air will be going at Invest 95 for enough time that the already-unimpressive convection associated with the system will be beaten down further. I do expect the invest to survive this initial beating of dry air, but as a consequence of pulling through that dry air mass and then having to fend off pockets of dry air on the way to the Dominican Republic, I am not expecting Invest 95 to reach hurricane status by the time it begins to affect Hispaniola. Tropical storm status will be tricky to achieve, as pockets of higher wind shear and iffy upper level winds hold down the invest from strengthening too much.

**EDIT: The National Hurricane Center has upgraded the risk of Invest 95 developing into a tropical cyclone to 60%. Disregard the last sentence of the above paragraph.

I will not make any calls for where Invest 95 could affect the US due to model uncertainty and the question of how strong the invest will be; the track of all tropical cyclones depends on how strong the system is, in addition to other atmospheric factors like upper/lower level winds, etc.

Andrew

Saturday, July 6, 2013

Invest 95 May Strengthen, Threaten the United States

Invest 95 has developed in the waters west of Atlantic. This appears to be the first piece of energy in the open Atlantic with the chance to develop into a tropical cyclone.

Invest 95 is currently placed at roughly the 8N latitude, 32W longitude and is seen on satellite as a mass of tropical convection with no clear circulation at this time. The current model suite shown above has Invest 95 moving on an increasingly-northwest-ward path over the next few days. There is a consensus of the storm moving north of the Dominican Republic and Haiti, but likely to affect both nations should the current model consensus hold.

Intensity forecasts for Invest 95 have a consensus of the system developing into a tropical storm in the next 36 hours, at which point it would be named Chantal. From there, the model consensus encounters large divergence at around the Hour 96 mark, at which point the storm begins to curve out northwest of Haiti and the Dominican Republic. As of now, all that seems likely is that we will see Chantal form in the next 24-48 hours.

The image above shows steering winds for a system with a pressure of 1000 millibars or above, which includes Invest 95. We see Invest 95 is shown by the yellows and oranges in the bottom right corner of the image. Using the white lines superimposed on the colors as a guide to where Invest 95 may go, it appears more likely to me that the track of this invest would tend to move more westward than northwest. From there, it does appear more probable that the invest (or Chantal, at that time) will start a northward movement.
From this northward movement comes the big question mark- just where will this system begin to turn north? I believe it has two options- turning north east of Florida or east of the Yucatan Peninsula. The first option would have the storm moving along the Southeast coast before likely moving out to sea. The second option would retain a landfalling US threat along the Gulf Coast. If Chantal were to enter the Gulf of Mexico, the chances of further intensification would be great. I will update the situation tomorrow.

Andrew

Friday, July 5, 2013

Models Raising Tropical Development Threat

Long range model forecasts indicate the chance of tropical development is increasing.

The image above shows the GFS Ensembles projecting sea level anomalies across the Atlantic basin. The image is an average of all members in the GFS ensemble suite. In this forecast, valid for July 20th, we see a large swath of below normal anomalies from the west coast of Africa to the northern tip of South America. Most pronounced in this swath is an area of significantly below normal area positioned almost due east of Cuba.

This appears to be a tropical wave that has pushed away from Africa and has strengthened into a potential tropical cyclone. The overall atmospheric flow across the Atlantic basin sees high pressure extending from the Southeast US into the waters offshore of the Mid-Atlantic. While the high pressure system in the Southeast is rather strong, we do not see prevalent high pressure in the center of the Atlantic Ocean, which means this enhanced tropical wave/cyclone would most likely stay out to sea.

Even though this may not happen when July 20th comes around, the models have certainly been aggressive with long range tropical cyclone formation in the Atlantic basin; could this be a sign that late July-August could get active?

Andrew

Tuesday, July 2, 2013

How Weather May Be To Blame for Some Earthquakes

Preword: This post contains information that some may find controversial. I publish this only to show the results of a study that some may find interesting, and I DO NOT intend to conclude that this is the future of earthquake prediction.  Use this post and its data with extreme caution.

For decades, there has been a struggle among geologists and meteorologists to find a cause for earthquakes that can range from a minor nuisance to lethal earth-shakers. Because of the closeness in the fields of geology and meteorology, there has been much discussion about a possible correlation between the two, possibly a correlation that could help predict earthquakes in advance. Based on a study I conducted, I believe I may have found a tool that could HELP (not completely predict) forecast the occurrence of an earthquake.

This study was composed of a total 43 'cases', in which 43 different earthquake events on the US Mainland were analyzed in magnitude, date and location. The ongoing weather situation at that time was then analyzed. 10 of these 43 cases will be shown below, and a full list of statistics on all 43 cases will then be illustrated. The image associated with each case shows vorticity values at the 500 millibar level.

CASE #1 - Central Oklahoma, 11/06/11 - 5.6 M.


A 5.6 magnitude earthquake struck northeast Ohio at approximately 3:56 UTC. The vorticity map shown above is from 3:00 UTC. As is shown, high positive vorticity values were approaching the Oklahoma area at the time of the observed earthquake, with two areas of strong low pressure seen in the central and northern Plains in association with this area of high vorticity.

CASE #2 - Arkansas, 2/28/11 - 4.7 M.

A 4.7 magnitude earthquake struck Arkansas at approximately 5:01 UTC. This map shown above is from 6:00 UTC. At the time of the earthquake, significant positive vorticity values were observed approaching the state of Arkansas from northern Texas and western Oklahoma.

CASE #3 - Northern California, 1/10/11 - 6.5 M.


A 6.5 magnitude earthquake struck the waters just a few miles offshore northern California at approximately 00:27 UTC. This vorticity map shown above is from 00:00 UTC. As is shown above, a lobe of elevated vorticity is shown offshore the west coast of Colorado, with a small area of higher vorticity immediately close to the northern California coast where the earthquake occurred. In similar stature to the previous two cases, high positive vorticity values were observed in the immediate vicinity of this earthquake.

CASE #4 - Northwest Colorado, 8/18/09 - 3.7 M.

A 3.7 magnitude earthquake struck northwest Colorado at approximately 2:50 UTC. The vorticity map above is from 3:00 UTC. As is shown above, a compact area of elevated vorticity was moving towards the area of the earthquake when the earthquake struck.

CASE #5 - Western California, 4/30/09 - 3.5 M.

A 3.5 magnitude earthquake struck west-central California at 22:51 UTC. This map is from 21:00 UTC. At the time the earthquake struck, a localized area of negative vorticity values was observed over the area where this earthquake occurred. Only one other case had an area of negative vorticity present at the time of an earthquake's occurrence.

CASE #6 - Western California, 3/08/09 - 3.5 M.


A 3.5 magnitude earthquake struck the San Francisco Bay Area at approximately 14:47 UTC. This vorticity map is from 15:00 UTC. As is shown above, an area of elevated vorticity was observed over the site of the earthquake, with an area of opposing negative vorticity close behind the positive vorticity swath.

CASE #7 - Northern New Jersey, 2/3/09 - 3.0 M.

A 3.0 magnitude earthquake struck northern New Jersey at approximately 3:34 UTC. The vorticity map above is from 3:00 UTC. As the map shows, a very large area of high vorticity values was observed approaching New Jersey at the time of the earthquake. Additionally, a lobe of increasingly-prevalent positive vorticity was seen stretching from North Carolina into Virginia that moved into the New Jersey area just hours after the earthquake struck.

CASE #8 - Southwest California, 1/9/09 - 4.5 M.

A 4.5 magnitude earthquake struck the Greater Los Angeles area at approximately 3:50 UTC. This vorticity map is from 3:00 UTC. As is shown above, an area of high positive vorticity was seen moving towards the Los Angeles area, with a large swath of negative vorticity values closely in pursuit. This reinforces the theory of this study that areas of anomalous vorticity (typically positive vorticity) may be the cause behind some earthquakes.

CASE #9 - North California, 4/30/08 - 5.4 M.

A 5.4 magnitude earthquake struck northern California at approximately 3:03 UTC. This vorticity map is from 3:00 UTC. As is shown above, a large area of positive vorticity is seen over the area where the earthquake occurred.

CASE #10 - Illinois, 4/18/08 - 5.4 M.

A 5.4 magnitude earthquake struck southern Illinois at approximately 9:37 UTC. The above vorticity map is from 9:00 UTC. At the time of the earthquake, a significant area of positive vorticity was moving towards the site of the earthquake, with a belt of large negative vorticity values west of a line of weaker positive vorticity anomalies. This continues the idea that anomalous vorticity values may be the cause of some earthquakes.

The following statistics cover all 43 cases, including the 10 listed above. For the statistics listing 'Supports study' or 'Does not support study', the theory is that anomalous vorticity values may be the cause of some earthquakes. This theory was then matched against 43 of the most recent US Mainland earthquakes.

26 out of the 43 cases support the study.
17 out of the 43 cases do not support the study.

60% of all cases do support the study, while 40% do not.

17 of the 43 cases originated in California.
29 of the 43 cases originated from mountainous terrain.
14 of the 43 cases originated from non-mountainous terrain.

Summary

More than half of the cases in this study favor the proposition that anomalous vorticity values either over or in the immediate vicinity of the earthquake may be the cause behind this earthquake. While the percentages of supporting the study/not supporting the study are still rather even (60% favor to 40% non-favor), this could be the first evidence that indicates weather may be a factor in some earthquakes.