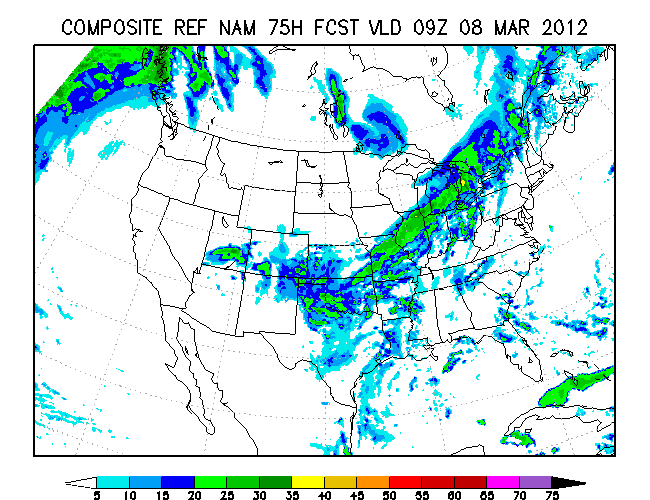
Forewarning- the NAM model we are using is not showing a definitive position for a squall line, so we are using the images that appear to maximize the threat in order to be too safe than sorry.
The South Plains is in for another round of severe weather in the next few days. Here's the low down.
 The country is currently experiencing a massive warm wave as a huge warm front pulls up air north as far the cities like Lincoln, Nebraska. This warm air is being pulled up ahead of this storm system that we are watching. As we progress into the timeframe being watched for severe weather, I am seeing the low pressure system eject eastward from the Southwest. Behind it will be an enclosed pool of below-freezing temperatures. You can see this pool of cold air just west and northwest of Texas, in that oval shape. This cold air is more than likely to be an instigator for showers and thunderstorms as this cool, dry air smashes against the warm Gulf air.
 Here is a chart showing various severe weather indices. Let's start with the 'observed buoyancy'. This is basically instability, known around the weather world as CAPE. CAPE values above 1000 are typically sustainable for thunderstorms, and values over 2000 units can support severe thunderstorms. In this image, we see CAPE values exceeding 1000 j/kg across easter Texas, which is where I am watching for the storms. The blue lines are absolute helicity, basically meaning spinning in the atmosphere, not accounting for CAPE. I emphasize that because CAPE is a very crucial part of severe storms, and a lot of helicity and no CAPE does not support tornadoes. In the image, we do see a lot of helicity, but it is located to the west of the area being monitored, decreasing the tornado threat in my eyes, but not nearly putting it to 0%.
 This is the Energy-Helicity Index (EHI), which accounts for helicity and CAPE, making for a much more reasonable tornado threat index than just helicity. Values over 1 are considered supportive (in the very right conditions) for tornadoes. Here, we see widespread values of EHI topping out at 1. Now, just because it is not at 1 does not mean the tornado threat is 0, but it is not a good thing for storm chasers. Running through the model shows me that this is about the most reasonable it gets.
 Here is a relatively unknown index that I am deciding to use to show that there remains a slight chance for some tornadic activity. This is the Vorticity Generation Potential, or VGP index. It detects the potential for spinning in the atmosphere. I cannot tell you if it is reliable, like the helicity discussion earlier in this post, as I do not know too much about VGP. I do know, however, that VGP values over 0.2 indicate an increasing chance of some tornadic activity.
In this image, we see widespread values of 0.15 to 0.20 across east Texas and Arkansas. There is a dark green area of 0.20 to 0.25 that is the highest realistic value in this situation. I say realistic because the dark green area pretty much covers where the squall line may move. Higher values denoted in the yellow areas are generally not going to be where the strongest storms occur in this situation.
 Finally, we have the infamous Significant Tornado Parameter, or STP. If you viewed The Weather Centre this past summer, you saw my continuous use of STP images, with widespread red and pink colors across the South Plains and Midwest. I have come around to say that the STP is pretty much useless in detecting the potential for tornadoes. I very much like the idea, but it's realistic use is not exactly practical. That said, these values of 1 to 3 across east Texas and Arkansas are basically saying 'There is a chance for a tornado, but don't bank on it'. That is also what I am saying at this point.
I'm leaving you with the Storm Prediction Center's Day 3 outlook that shows this potential threat.

 Questions may be asked below.
Also, if you are a weather fanatic and like to discuss weather, I encourage you to also comment, because it gives everyone (including me) a different insight into this situation and others.
-Andrew
The South Plains is in for another round of severe weather in the next few days. Here's the low down.


In this image, we see widespread values of 0.15 to 0.20 across east Texas and Arkansas. There is a dark green area of 0.20 to 0.25 that is the highest realistic value in this situation. I say realistic because the dark green area pretty much covers where the squall line may move. Higher values denoted in the yellow areas are generally not going to be where the strongest storms occur in this situation.

I'm leaving you with the Storm Prediction Center's Day 3 outlook that shows this potential threat.


Also, if you are a weather fanatic and like to discuss weather, I encourage you to also comment, because it gives everyone (including me) a different insight into this situation and others.
-Andrew