Sunday, May 5, 2013

Atmospheric Analysis - May 4, 2013

This post will address the synoptic atmosphere from May 4th to May 20th.

Current state of the atmosphere is rather bizarre in my opinion, with the United States (henceforth abbreviated as CONUS) under a deep closed low centered in the Plains at this hour. This closed low attains a minimum pressure of over 1000 millibars, although that value is deceiving. Observed temperatures show 60 and 70-degree temperatures being thrown up across the Southeast and Ohio Valley on the eastern side of this storm system as it meanders in the Plains. Further to the north, massive high pressure acts as a barrier to protect Canada from this closed low and bring a stretch of rather quiet weather to the region. Greenland is under a solid storm system, indicating that the North Atlantic Oscillation (NAO) is in its positive (warm weather for the CONUS) phase. A lack of defined height anomalies across the Arctic doesn't help me as far as trying to figure out synoptic temperature trends over the next 48-72 hours. Dynamic situation set up in East Asia, as a strong storm system is going to battle with two ridges of high pressure. Bering Sea is void of any significant height anomalies, complicating the act of figuring out just what the atmosphere wants to do in the aspect of warm or cold temperature trends in coming days.

We first look at the short/medium range forecast, with the American GFS ensembles forecasting 500 millibar height anomalies- the same anomalies as the left-hand panel in the top image. This forecast is valid for the morning of May 10th. On this day, we observe a highly meridional flow across the United States. Elongated high pressure extends from the Pacific Northwest along the western Canadian coastline and into Alaska. The ridge, with its full length spanning from the northwest Plains to extreme northeast Russia, acts as a barrier between a strong area of low pressure in the northeast Pacific. This ridge also allows the formation of a Rex Block in the Western US, with high pressure in the Pacific Northwest opposing low pressure in the Southwest and Southern Plains. Common traits of the Rex Block include a relatively zonal flow downstream of the blocking pattern, and this is somewhat evidenced into the central and eastern parts of the nation. Weak high pressure forms a bridge between the Rex Block ridge and moderate high pressure east of the Canadian Maritimes, and this forms the zonal flow east of the Rex Block. Low pressure in the Southern Plains acts to create some disruptive weather across the Gulf Coast states, but nothing significant in the synoptic aspect is anticipated. Around the rest of the Northern Hemisphere, strong low pressure envelops northern Canada into Greenland, symbolizing a positive Arctic Oscillation (AO)- if you recall, the positive AO helps high pressure and warm weather transpire across the contiguous United States. Low pressure extends into Greenland, defining the positive NAO. Rather stormy East Asian region indicates the United States may see some stormy weather after May 16th, although that is to be determined.

Examination of the long range brings us to the morning of May 18th, using the same ensemble set and same 500mb height anomaly index. General atmospheric flow is much more zonal across the board in the long range, with high pressure dominating the United States and western Canada. Such a zonal flow would certainly allow for at least seasonable temperatures to develop across the nation. I am skeptical of low pressure trying to push south through Canada; I fear that the ensembles are overdoing the zonal flow in the CONUS, and cooler weather may be in store for the Upper Midwest in the long range. Arctic Oscillation remains positive in the long range, and North Atlantic Oscillation follows suit. As we get closer to this date of May 18th, I expect the ensembles to see this highly zonal flow turn more meridional- ensemble sets have a natural tendency to make the atmospheric flow far too calm than what ends up happening.

Andrew

Saturday, May 4, 2013

Arctic Outbreak May Strike Mid-May


It looks like an Arctic Outbreak may be in the offing for the middle days of May, just as many began to think that the chilly spring would finally retreat.

The European model is shown above, projecting temperature anomalies 5000 feet off the ground for the morning of May 14th. A large swath of well below-normal temperatures is seen swinging into the northern Plains, Midwest and Northeast. It does appear that this outbreak would occur following the passage of a storm system across southern Canada, which is the typical way an arctic cold event transpires. This outbreak is not yet showing up on the American GFS modeling system, and is only shakily supported by the ECMWF model and its ensemble set. That said, the synoptic set-up isn't all that impossible.

A strengthening Madden-Julian Oscillation wave currently making its way across the waters north of Australia will push east into the open waters of the Pacific. As this transition occurs, the MJO will enter Phases 2 and 3, the latter of which we are watching for cold weather potential. The projected timeframe for this arctic outbreak falls on roughly May 14th, which equates to Phase 3 in this European MJO forecast. Ensemble members from the European forecasting system are shown in yellow lines as being in a decent consensus on a moderate-strength Phase 3 MJO status for May 14.

The typical atmospheric set-up for a Phase 3 MJO during the month of May is shown above. We tend to see high pressure building over the Bering Sea into western Asia and Siberia. The result includes low pressure being elongated into two main centers; one east of Greenland and one in north central Canada. With the presence of another high pressure system in the Canadian Maritimes, the second low pressure area can be coaxed to squeeze south into central or even south central Canada. The situation may then turn towards producing low pressure in the northern US in response to the southern shifting of the Canadian low pressure system. Altogether, it comes down to cold weather being more obligated to push towards the US. The cold weather does not necessarily penetrate the United States, but the likelihood of a cold weather event with a synoptic set-up like the one shown above is increased.


Minimum temperatures for the morning of May 14th tell the story, with widespread temperatures in the 20s and 30s extending across Canada and well into the Plains, Great Lakes and Midwest. We even see the freezing line pushing towards northern Missouri and southern Nebraska. As I told above, model guidance is uncertain on the evolution of this scenario. American model guidance is unsupportive, and European guidance that is supportive of such an incident happening is rather inconsistent from run to run. I prefer to leave this event at the 'possible' level rather than elaborating on how this could all go down- I really want to see more model support for this situation before going ahead with potential implications and other effects of this arctic outbreak.

Andrew

Friday, May 3, 2013

Severe Weather Prognosis - May 3, 2013

This discussion concerns the next week and how severe weather may evolve within that timeframe.

Madden-Julian Oscillation is predicted to strengthen and move into the middle phases as the next 7 days evolve. Current stage of MJO is in weak Phase 1 as the above image shows. The GFS Ensembles predict the MJO wave to move through Phases 2 and 3, both of which are known to ignite severe weather concerns. Phase 2 has been judged by multiple meteorologists to have an atypically high risk of tornado outbreaks. Main concern for this discussion is centered around the time that the MJO spends in Phase 3. Time spent in Phase 2 is of little interest, as unusual weather pattern involving a massive closed low in the Plains situates itself in the region for the period of time the MJO spends in Phase 2. By the time the Madden Julian Oscillation wave reaches Phase 3, the closed low will have moved out of the contiguous United States and another storm system will be forcing itself through the Southwest and Southern Rockies. It is this timeframe when our first severe weather risk arises.

Vorticity map shows closed low on the Eastern Seaboard and the next storm system pushing through the Southern Rockies. Future forecasts going into the overnight hours of May 8-May 9 include high instability values and extreme supercell composite values. Capping inversion will likely prove problematic should the current forecast pan out, but the event's details will be addressed in a future post.

Madden-Julian Oscillation will be in Phase 3 during this timeframe, and analogs were examined for springtime Phase 3 dates. These dates were gathered from 2011 to 2006, with candidate months including April through June. Storm Prediction Center storm reports from all dates in these five years were examined, and 17 of 19 analog days included a synoptic severe weather event. The conclusion indicates that Phase 3 of the MJO does include severe weather potential.

Concern then falls to the aforementioned May 8-9 potential severe weather event. Current forecasts have this event progged to be relatively significant, but further analysis is needed in coming days to assure or disprove this estimation. Not willing to examine any dates beyond the May 8-9 timeframe, uncertainty in both model predictions and MJO forecasts are too great to give any confidence.

Andrew

Thursday, May 2, 2013

El Nino-Southern Oscillation Discussion: May 2013

This is a discussion of the El Nino-Southern Oscillation for May 2013.

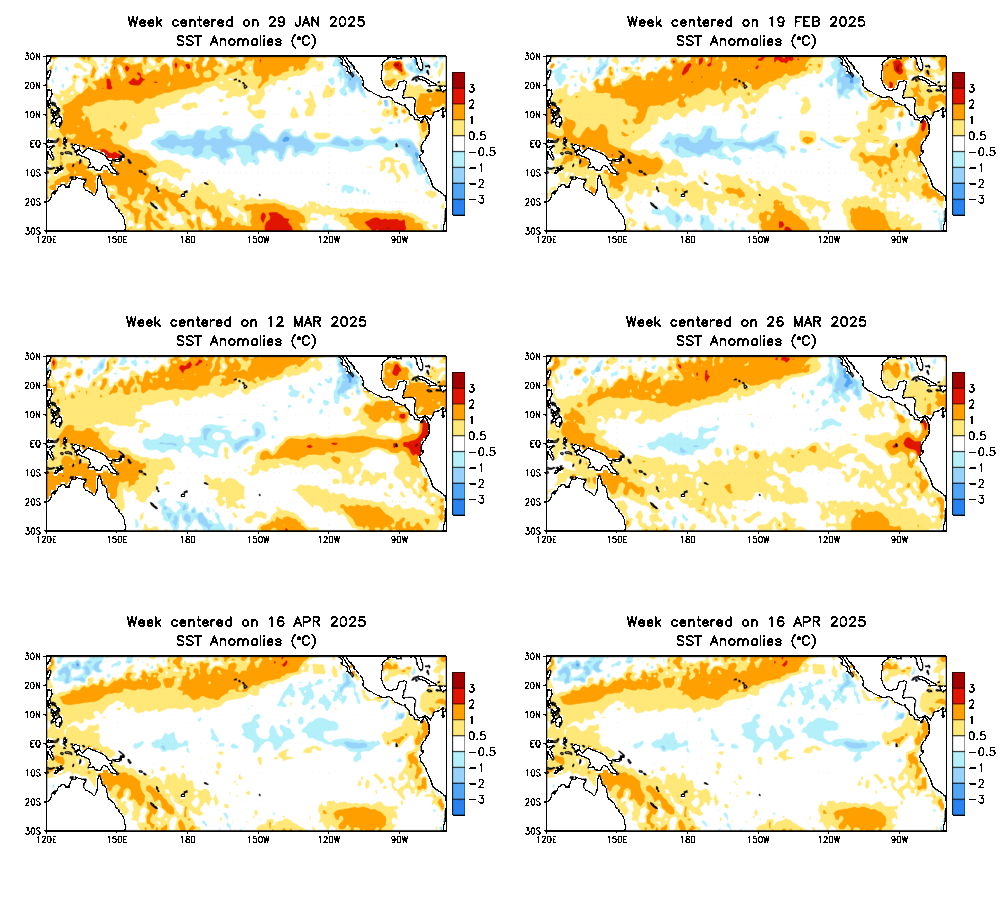
This animation of sea surface temperature anomalies from early February through late April shows conditions of water temperatures from the western Pacific to the eastern Pacific. Beginning in February and lasting through mid-March, we saw a weak strand of below-normal sea surface temperatures stretching on a nearly straight west-east line from the northwest South American coastline. This strand of slightly cooler than normal temperature anomalies dissipated by late March, bringing an end to whatever slight La Nina (colder than normal sea surface temperatures) may have otherwise developed. Beginning in the closing days of March, we began to see a warming trend across the same region of the eastern Pacific Ocean. However, because the waters were not sustained and not warm enough, an El Nino (warmer than normal sea surface temperatures) event did not develop. Since the beginning of April, ENSO-Neutral conditions have prevailed, with no defined El Nino or La Nina present at this time.

Mike Ventrice
Image above depicts the current situation that is ongoing across the world's oceans with several different weather parameters. We begin with the top image, showing unfiltered VP200 anomalies. In a nutshell, a higher anomaly of this indicator tells one that tropical convection is enhanced in the area. A glance at our second indicator, labeled MJO, shows us that this tropical convection idea is true. A large swath of positive anomalies is outlined on the MJO indicator across the Indian Ocean and east towards the Philippines. The positive anomaly placed in those regions means that the Madden-Julian Oscillation is in Phases 1-2. When the MJO is in Phases 1-2, effects on the United States' weather include above normal precipitation in the central and east US, as well as below normal temperatures in the same regions. The expectation is for this MJO wave to strengthen and push east across the Pacific Ocean to progress the Madden-Julian Oscillation through its middle phases 3-5. These phases provoke slightly warmer and generally drier weather. As the MJO wave moves east, a Kelvin Wave already forming in the waters northwest of Australia should also push east. In the third image on the bottom, we see a highlighted blue oval, suggesting the presence of a Kelvin wave that will most likely move east with the MJO progression. As they both push east, the Kelvin wave should act to bolster attempts at producing an El Nino, as the Kelvin wave is known to enhance convection and boost warmer waters over the eastern Equatorial Pacific.

Summary
The ENSO state at the present time is: NEUTRAL
The presence of a Kelvin wave is: CONFIRMED
Likelihood of a changing ENSO state within 3 months: POSSIBLE

Andrew

East Pacific Hurricane Season Eyeing Quick Start

The East Pacific hurricane season appears to be looking for a quick start, with a long range forecast seeing rising probabilities of tropical cyclone formation in the region to end May.

The image above shows tropical cyclone probabilities for May 29th across the globe. Areas with warm colors indicate an increased risk of formation. This forecast, created by the University of Albany's Paul Roundy, shows the increased probabilities off the western coast of Mexico. June 1st is the official start date of the Atlantic hurricane season, while May 15th signals the beginning of the tropical season in the East Pacific. It is not uncommon to see a tropical season get off to a rather quick start, and does not necessarily mean a more active year. As of now, it appears that the probabilities for tropical cyclone formation begin to increase going into the last week of May. I have reviewed many forecasts from this source over the last few weeks, and have found them to be rather consistent. If this does pan out, folks from Acapulco to La Pez may want to watch the tropics around the start of June to see if any trouble is brewing.

I will have more on this potential as it develops throughout the next couple of weeks.

Andrew