Tuesday, September 30, 2014

Weak Stratospheric Warmings Suggest Turbulent Winter Ahead

The first substantial stratospheric warming event appears to be underway in the Northern Hemisphere, and could be a signal for what's ahead this winter.

CPC
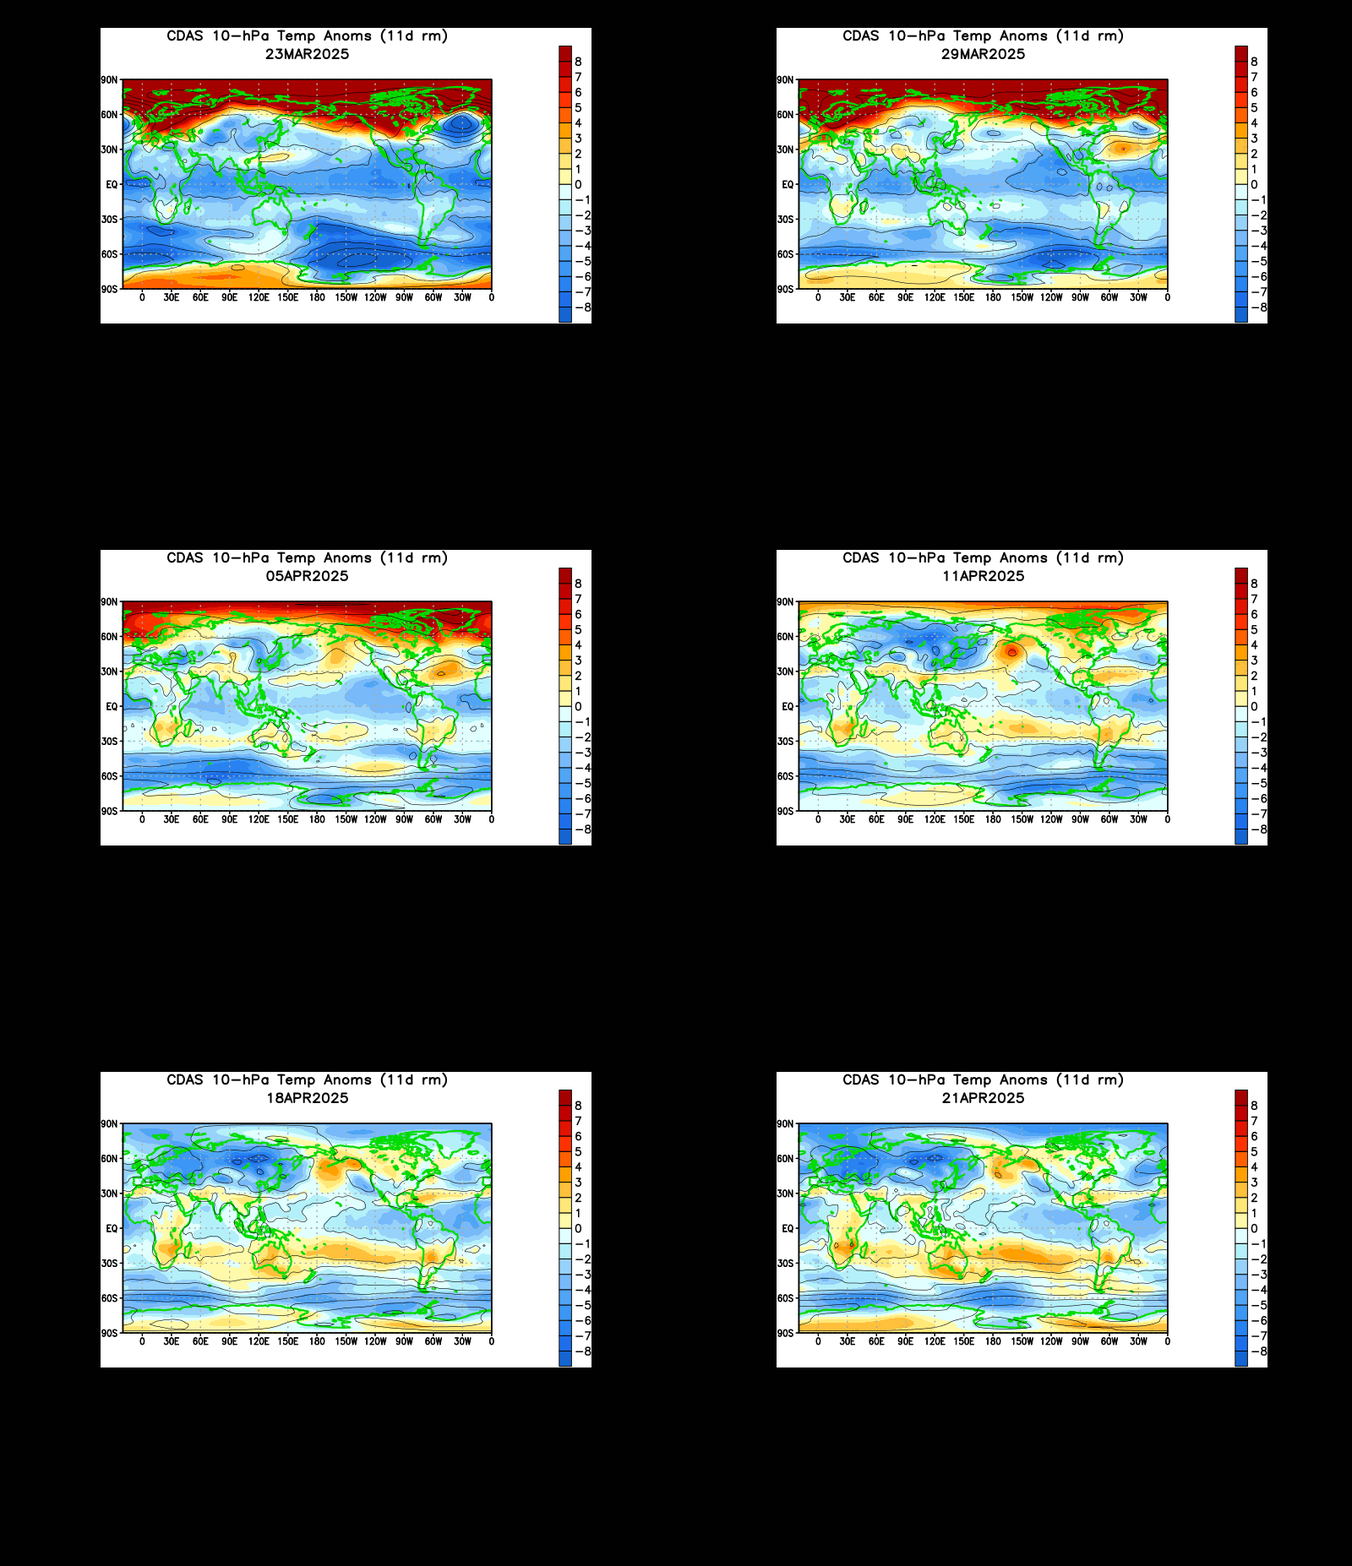
The animation above shows temperature anomalies at the 10 millibar level of the stratosphere across the world over the past month. The Southern Hemisphere has been on the receiving end of more than one powerful sudden stratospheric warming (SSW) event, but we'll focus our attention on the Northern Hemisphere for now.

Take a look at what's been happening over Canada and into Greenland in recent days. We've been seeing warmer than normal temperature anomalies push northward from Canada into Greenland, and now across the Arctic Circle. In the winter, when these events happen, outbreaks of cold air may be expected at lower latitudes approximately 2-4 weeks after the event. This warming is pretty minor, so I wouldn't expect any significant cold to come from it, but there's more to this whole process.

CPC
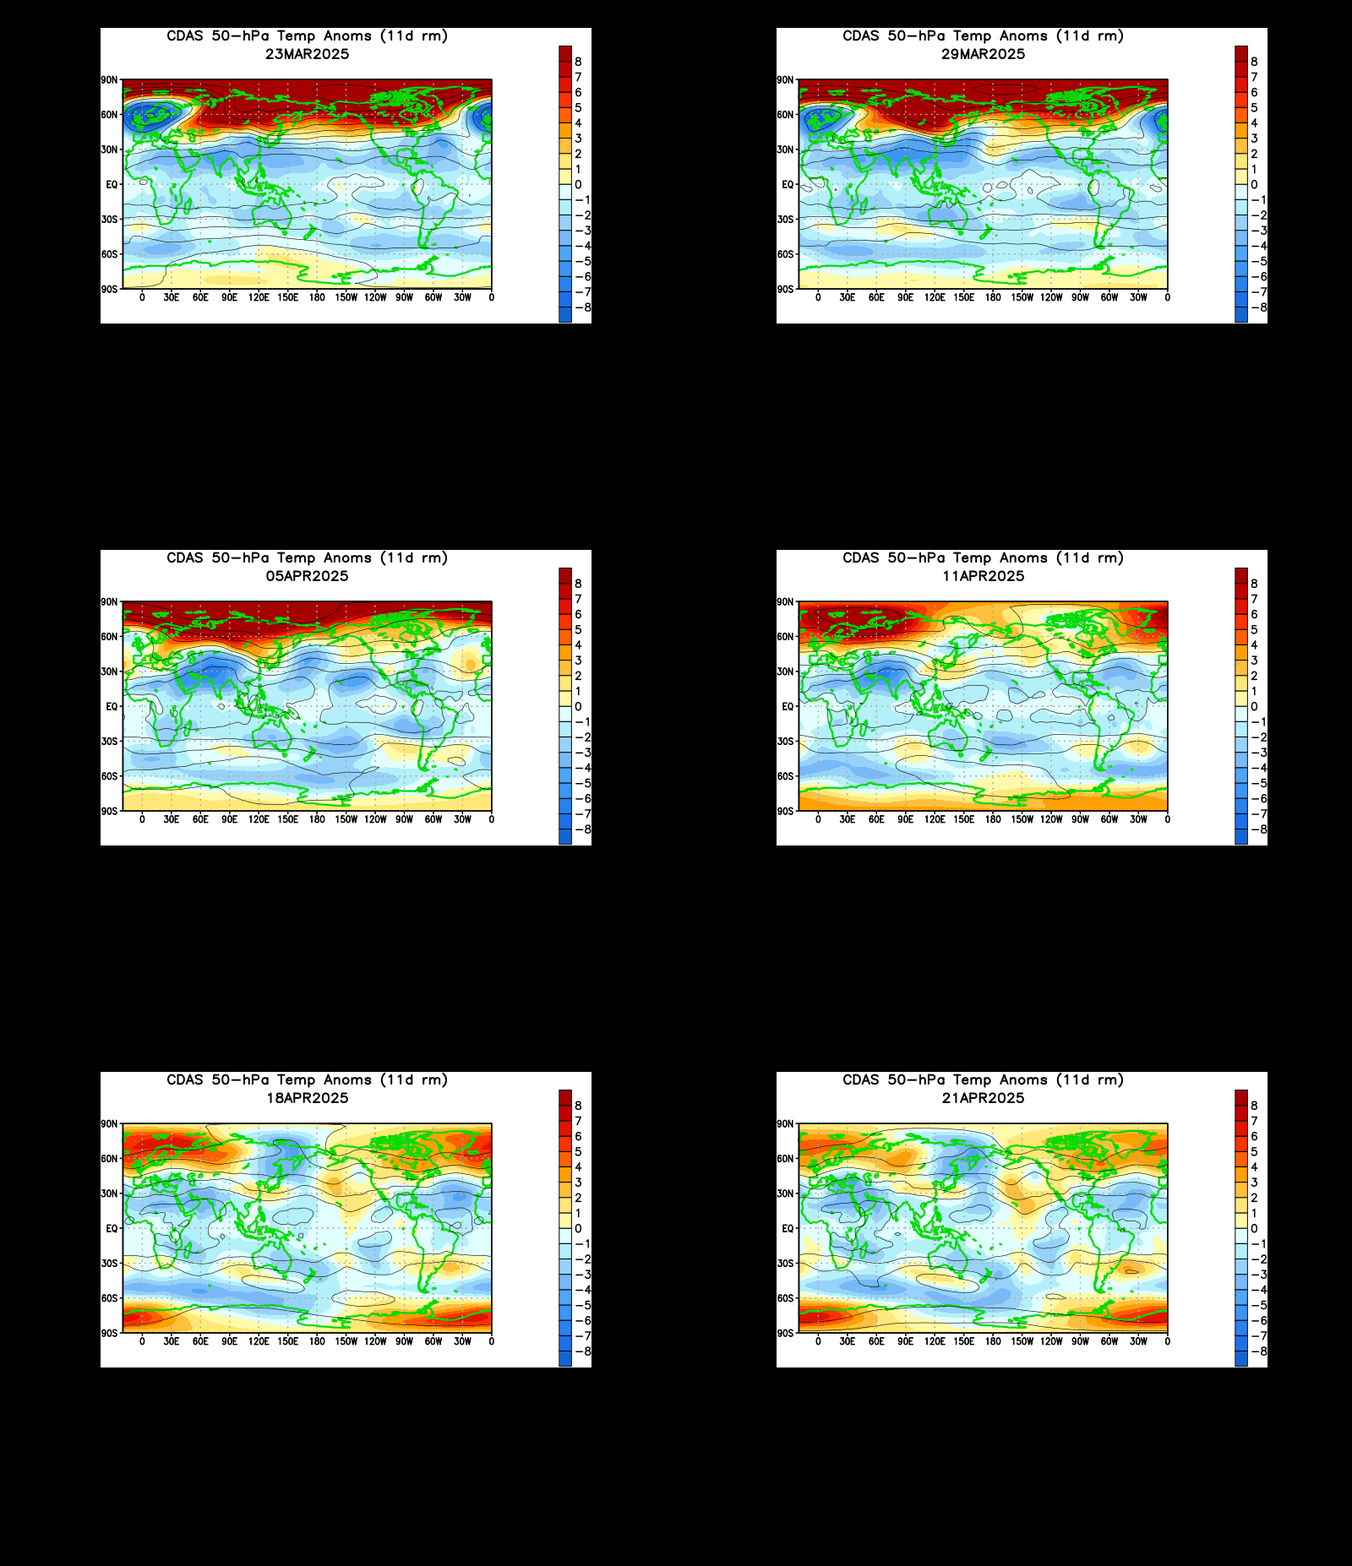
If we look at the same animation, now at the 50 millibar level of the stratosphere (generally considered the middle of the stratosphere), we still see that swath of warmth pushing north from Canada into Greenland, and actually extending westward into the Pacific as the warmth is shoved into the Arctic. The presence of this warmth across the upper and middle stratosphere means that this isn't just a fluke warming, but in terms of an early-season stratospheric warming event, this one's pretty substantial.

All of this may be hinting at what kind of winter we'll see this season. If the stratosphere is already rather vulnerable to warm air invasions, it could mean that the polar vortex, which spans the troposphere and stratosphere, may be weakened significantly this winter, possibly leading to more frequent wintry outbreaks. The chance of this polar vortex weakening is raised by the expectation for stratospheric winds to be unfavorable for the formation of a strong polar vortex.

More on this will be analyzed in the near future.

Andrew
Sunday, September 28, 2014

Above-Normal Stratospheric Temperatures May Signal Blocky Winter Ahead

Warmer than normal temperatures in the lower stratosphere are raising the possibility of a "blocky" winter ahead.

CPC
The above image shows a pretty daunting image of the stratosphere, so let's decipher it. The red line shows observed temperatures at the 70 millibar level of the stratosphere, between the 65N and 90N latitude lines. The dashed green line illustrates average temperatures for any given time, while the gray outlines give an indication of the record high and low stratospheric temperatures for any given time period over the past few decades of records.

Gazing over the image above, specifically around the most recent records of temperatures, we find ourselves on the above-normal side, with that red line bursting up into above-normal territory more than once in the last few weeks. This year's warmth at the 70mb level looks to be a bit more prevalent than that of last year, as you can see just to the left of the center of this image.

Why is this important to the coming winter? Above-normal temperatures in the stratosphere allow for a higher threat for persistent high pressure to form over the Arctic Circle, and general upper-latitude area. The polar vortex, a strong low pressure system of cold air located across the troposphere and stratosphere, can be strengthened during times when the stratosphere is colder than normal, and weakened when warmth prevails.

When this warmth prevails, strong bodies of high pressure can punch north from the lower latitudes into the Arctic, disrupting the polar vortex. When this happens, fragments of the vortex can break off and be sent to the lower latitudes (as was seen last winter), or the whole vortex can be shunted down south. If the high pressure sticks around in the Arctic for long periods of time, it can be referred to as "blocking" high pressure, for the way it "blocks" the pattern from flowing east to west around the globe, since the high pressure remains stagnant and backs everything up.

DMI/COI
The risk for sustained high pressure is increased as we see above-normal temperatures affecting the surface of the Arctic. The graphic above shows us observed temperatures north of the 80th parallel from the first day of the year to present day. Over the summer, we saw sustained below-normal temperatures, as evidenced by the red line being below the green average-temperature line, and I had discussed this as showing a potential cold air build-up for the upcoming winter.

Things certainly have changed since then! In the past couple of months, temperatures north of the 80th parallel have stayed predominantly above-normal, only reaching the average line a few times. The most recent observation shows temperatures diving, but the anomaly is still above-normal for this time of year.

For winter weather fans and warm weather fans, this is a double-edged sword.

On one hand, the lack of colder-than-normal air means not as much cold air may be available for the coming winter, barring a regime shift that would cool down the upper latitudes. Such a scenario could then mean a general 'warm-ish' feel for the coming winter, where cold weather would still occur (since it's the winter season), but the intensity of cold air may not be that extreme.

On the other hand, the warmth both at the surface and into the lower stratosphere suggest a pretty elevated risk of that blocking high pressure this coming winter. All of this warm air in the Arctic has a pretty decent chance of depleting the polar vortex this winter, and this risk is increased even further per some items that will be discussed in our Official 2014-2015 Winter Forecast on October 11th at 12:00 PM Central Time.

To summarize, above-normal temperatures across both the stratosphere and troposphere appear to be raising the risk of blocking high pressure in the upper latitudes this winter, which could then raise the risk of a cold winter in North America.

Andrew

Saturday, September 27, 2014

Persistent Cold Pattern Expected to Succeed Current Warmth

Another bout of cold weather is expected to replace the nice weather that most of the United States is currently feeling.

NAEFS
The first image we'll analyze above is the North American Ensemble Forecast System, or NAEFS 500mb height forecast. The contour lines show isobars at the 500mb level, with colored regions showing the degree of uncertainty, or "spread" among the ensemble members.

The graphic above, valid October 3rd, shows a deep trough pushing south into the Central US. We can see this well by the NAEFS projected depression of 500mb height contours. A glance around North America tells us this troughing pattern looks to be supported by two areas of ridging. One body of high pressure looks to be positioned in the West US, in a more suppressed version of last winter's ridging episodes, while the other ridge appears to be positioned along the Southeast and East Coast, evident by the arcing motion of the 500mb height contours.

Something we will have to monitor in the days leading up to this outlook of October 3rd is the high uncertainty over the Plains with this trough. The NAEFS outlook shows greens and yellows encompassing the expected placement of the trough, which means ensemble members aren't so sure this will actually end up happening. However, as the trough is actually showing up on this image, it means more members support it than not, a positive sign for this trough being able to form.

CMC
This next ensemble projection, from the Canadian ensemble system, shows 500mb height contours valid on October 6th. In agreement with the NAEFS ensemble forecast, we still see that trough centered over the Plains and Midwest, now trying to push a bit east into the East Coast. Sustained ridging is still highlighted over the West US, and a bit still present in the Southeast. A look at the individual members of this ensemble mean image shows only two of the twenty members do not show a large trough in the Central US on this date. Therefore, confidence is rather high that this cooler pattern will play out.

ECMWF
Lastly, we'll take a look at the ECMWF ensembles' outlook for October 3rd, the same time period as the NAEFS graphical outlook. In this forecast, we see a large trough placed over the Central US, echoing the projections made by the NAEFS and CMC ensembles. Adding to the similarities is the rather large spread / degree of uncertainty among ensemble members, as the deeper purple colors on the right-hand panel above show over the Plains. Because it's still showing up in the ensemble mean images here, I would keep confidence in this cold outlook for the start of October, but still be wary for changes in the outlook in the near future.

To summarize, model guidance is agreeing on the potential for a cold blast to kick off October, but individual projections are exhibiting varying degrees of uncertainty as to just how intense the cold may be.

Andrew

Friday, September 26, 2014

CFS Weeklies Determining Upcoming Winter Storm Track

The weekly outlook version of the CFS model, as well as 45-day precipitation forecasts from its four ensemble members, appear to be starting to figure out the upcoming winter storm track.

CPC
The image above shows two weeks' precipitation anomalies, one panel for each week. The top panel shows the first week's precipitation anomaly outlook, from September 26th to October 2nd, while the bottom panel shows anomalies for the October 3rd through 9th period. In the top panel, we see a general dry spell expected to linger throughout the East US, as strong ridging induced by a stormy West keeps weather systems at bay. It is this stormy West that will lead to above-normal precipitation anomalies in this same timeframe.

For the second week, valid from October 3rd to October 9th, we see the pattern change. Below-normal precipitation anomalies take hold in portions of the Western US, most notably the Pacific Northwest. Above-normal precipitation anomalies then take hold in the Central United States, including the Gulf Coast. These wet conditions will hit this region in a crucial time, as the new Lezak Recurring Cycle, or LRC, begins to take shape. I'll have more on that later on in this post.

CPC
This next graphic is the same as the one we just analyzed, but now valid for the Week 3 and Week 4 period. The top panel shows the precipitation anomaly forecast from October 10th to October 16th, while the bottom panel shows the anomalies from October 17th to October 23rd. During the first week, the latest CFS outlook has those below-normal precipitation anomalies persisting in the Pacific Northwest, now also being reciprocated in the Ohio Valley and South Plains. Wetter than normal conditions do prevail in the Northern Plains and Upper Midwest, through that's the only area that experiences such an anomaly throughout the country.

By the fourth week, we once again see above-normal precipitation anomalies return to the Midwest and Great Lakes, stretching into the Mid-Atlantic. Variable conditions look to exist across the Plains and most of the West, save for the Pacific Northwest.

All of this is pretty important to us, as this looks to occur during the month of October, when the new Lezak Recurring Cycle forms. Something I've discussed on here more than a few times is the concept of the Lezak Recurring Cycle, or LRC. The LRC was developed by meteorologist Gary Lezak, and discusses the idea that weather patterns which develop in October leave a 'footprint' of sorts that is repeated in a regular interval, between 40-60 days through the winter and following spring. In other words, the weather patterns that develop in October repeat themselves for the better chunk of the next year.

If we take that description of the LRC and look back at those panels of precipitation anomalies for the month of October, the general idea is that parts of the Midwest, Great Lakes, North Plains, and even East Coast could be in for a snowy winter.

Let's keep this model analysis going with additional (but different) CFS products.

WxCaster
This is the first of four images from the WxCaster site. In this graphic, we see the projected accumulated precipitation from one of four CFS ensemble members, all valid from today to November 9th. In other words, this image shows total precipitation from today to the ninth of November. Using our LRC guidelines, this should help capture most of the 'new' precipitation pattern as it unfolds in October and into November.

On this first graphic, this particular CFS member foresees a rather dry October and early November for the Midwest and Great Lakes, in opposition to the 16-member weekly panels we analyzed earlier. Instead, the heaviest precipitation is shunted north, into the Central and Northern Plains, or east into the Eastern Seaboard. Just going by this graphic alone, I would favor a snowy winter for the East Coast and Plains. Let's see what the other members say.

WxCaster
This second member shows a much different story than the first one. In this projection, the heaviest precipitation over the next 45 days is dropped on the Midwest and Great Lakes, in a similar fashion as the CFS weekly panels earlier in this post. The Northeast also would see a very wet October and November.

We now have two opposing ensemble members. We can't draw a conclusion from them just yet, so let's move ahead to the next member.

WxCaster
This third member is definitely more toned down than what the second member showed, but is more in line with that second member's geographical location of the anomalies compared to the first member. In this graphic, we see substantial precipitation extending from the South Plains into the Midwest and Ohio Valley, all the way into the Mid-Atlantic. This outlook does look similar to those weekly panels we discussed.

WxCaster
Our fourth and final member we will analyze takes the middle ground between these ensemble projections. According to this outlook, one track of very wet conditions for October and November would set up in the Plains, while another would hit the Midwest and Great Lakes. I might also be able to see a third area of wet conditions in the Mid-Atlantic and up the East Coast. Put it all together and this member definitely foresees an active LRC pattern ahead.

To summarize, while there are certainly discrepancies among model outlooks, and accuracy isn't that high with long range forecasts to begin with, it seems a trend favoring a wet October for parts of the Plains, Midwest, and East Coast may be in order. If this verifies, it could lead to a more secure winter storm track, quite possibly a snowy one.

Andrew

Thursday, September 25, 2014

Long Range Guidance: Atmosphere Primed For Intense Winter

Long range guidance appears to be favoring the Madden-Julian Oscillation (MJO) to remain in its latter phases this winter, something that could make this winter a brutal one.

BOM
Let's first define what the Madden-Julian Oscillation is. The MJO is comprised of the placement of enhanced tropical convection over certain parts of the Equatorial Pacific and Indian Ocean. The chart above shows Outgoing Longwave Radiation (OLR) anomalies for each of the eight phases of the MJO; each phase is numbered in the bottom left corner. Blue shadings indicate negative OLR anomalies, which translates to enhanced convection in the area. Similarly, yellows depict positive OLR values, which indicate suppressed tropical convection. You can see how, as the phases progress, the enhanced convection in blues shifts eastward. Phase 1 begins with storminess nearly due south of India, while Phase 8 has that same storminess well east-northeast of Australia.

JAMSTEC
Let's put what we've learned to the test. The image above shows the precipitation anomaly forecast from the JAMSTEC model, valid over the upcoming winter months of December, January and February. Instead of focusing in on North America, we're going to concentrate on the anomalies over the western Pacific. In this forecast, well above normal precipitation anomalies are targeting the region just north and east of Australia. This is a big clue to us that the enhanced tropical convection we discussed earlier will be centered in those green anomalies.

If we compare the placement of the above-normal precipitation anomalies on the JAMSTEC model to the average negative OLR placement for each MJO phase in the first image of this post, it looks like this graphic is suggesting a predominantly-Phase 6 MJO for this winter. It's expected that the MJO won't remain solely in Phase 6 for the whole winter, but this model says it should stay in Phase 6 more often than not.

CPC
This next image is nearly identical to the one we analyzed from the JAMSTEC model. This graphic is from the CFS model, and once again shows projected precipitation anomalies over the December-January-February period for the coming winter. As in the JAMSTEC image, green indicates above-average precipitation, while orange depicts below-normal precipitation.

According to this image, we see a swath of above-normal to well-above-normal rainfall anomalies positioned well to the northeast of Australia. If we do a quick check of the composite image that we first discussed to kick off this post, it's apparent that the CFS model is favoring a mainly-Phase 8 winter.

JMA
This final image seems daunting at first, but it's relatively easy to decipher. We'll examine the bottom image for this post, though some of you more experienced weather enthusiasts may know what the top panel means as well.

The bottom panel shows the Japan Meteorological Agency (JMA) three month rainfall outlook over the tropics and mid-latitude. In this graphic, yellows and oranges depict below-normal precipitation, while blues indicate above normal precipitation. According to the JMA, the precipitation anomalies are positioned northeast of Australia, almost a middle ground between the JAMSTEC and CFS models. A glance at the OLR composite and comparing it to the JMA forecast, the MJO appears to be favored to stick around Phases 6 and 7, maybe a bit into Phase 8.

Let's now go over what these different phases mean for the US during the winter.

The image above, from AmericanWx, shows temperature anomalies over the Northern Hemisphere during all amplitudes for Phase 6 MJO events during January (I chose the month as a middle ground, since there were no three-month composites for December-January-February). The image does show cold weather in the western part of Canada, and warm weather in the east. This could translate to warm weather in the East US and chilly weather in the West during Phase 6 MJO events, but we can't make a confirmation on that, since we just don't see it on this chart.

If we now take a look at 500mb height anomalies during a Phase 8 MJO event, we see a much different story than that associated with a Phase 6 event. During Phase 8 events, strong ridging evolves over the Western portion of North America, with strong troughing in the East US and Central US. This translates to warm weather in the west, and cold weather in the east. The anomalies are much more decisive than those with the Phase 6 chart, and if the CFS projection verified from earlier in this post, it's possible another brutal winter might be in store.

To summarize, long range model guidance is hinting at the atmosphere being primed for a pretty harsh winter in coming months, if the Madden-Julian Oscillation cooperates.

More on how the atmosphere is becoming primed in a future post...

Andrew