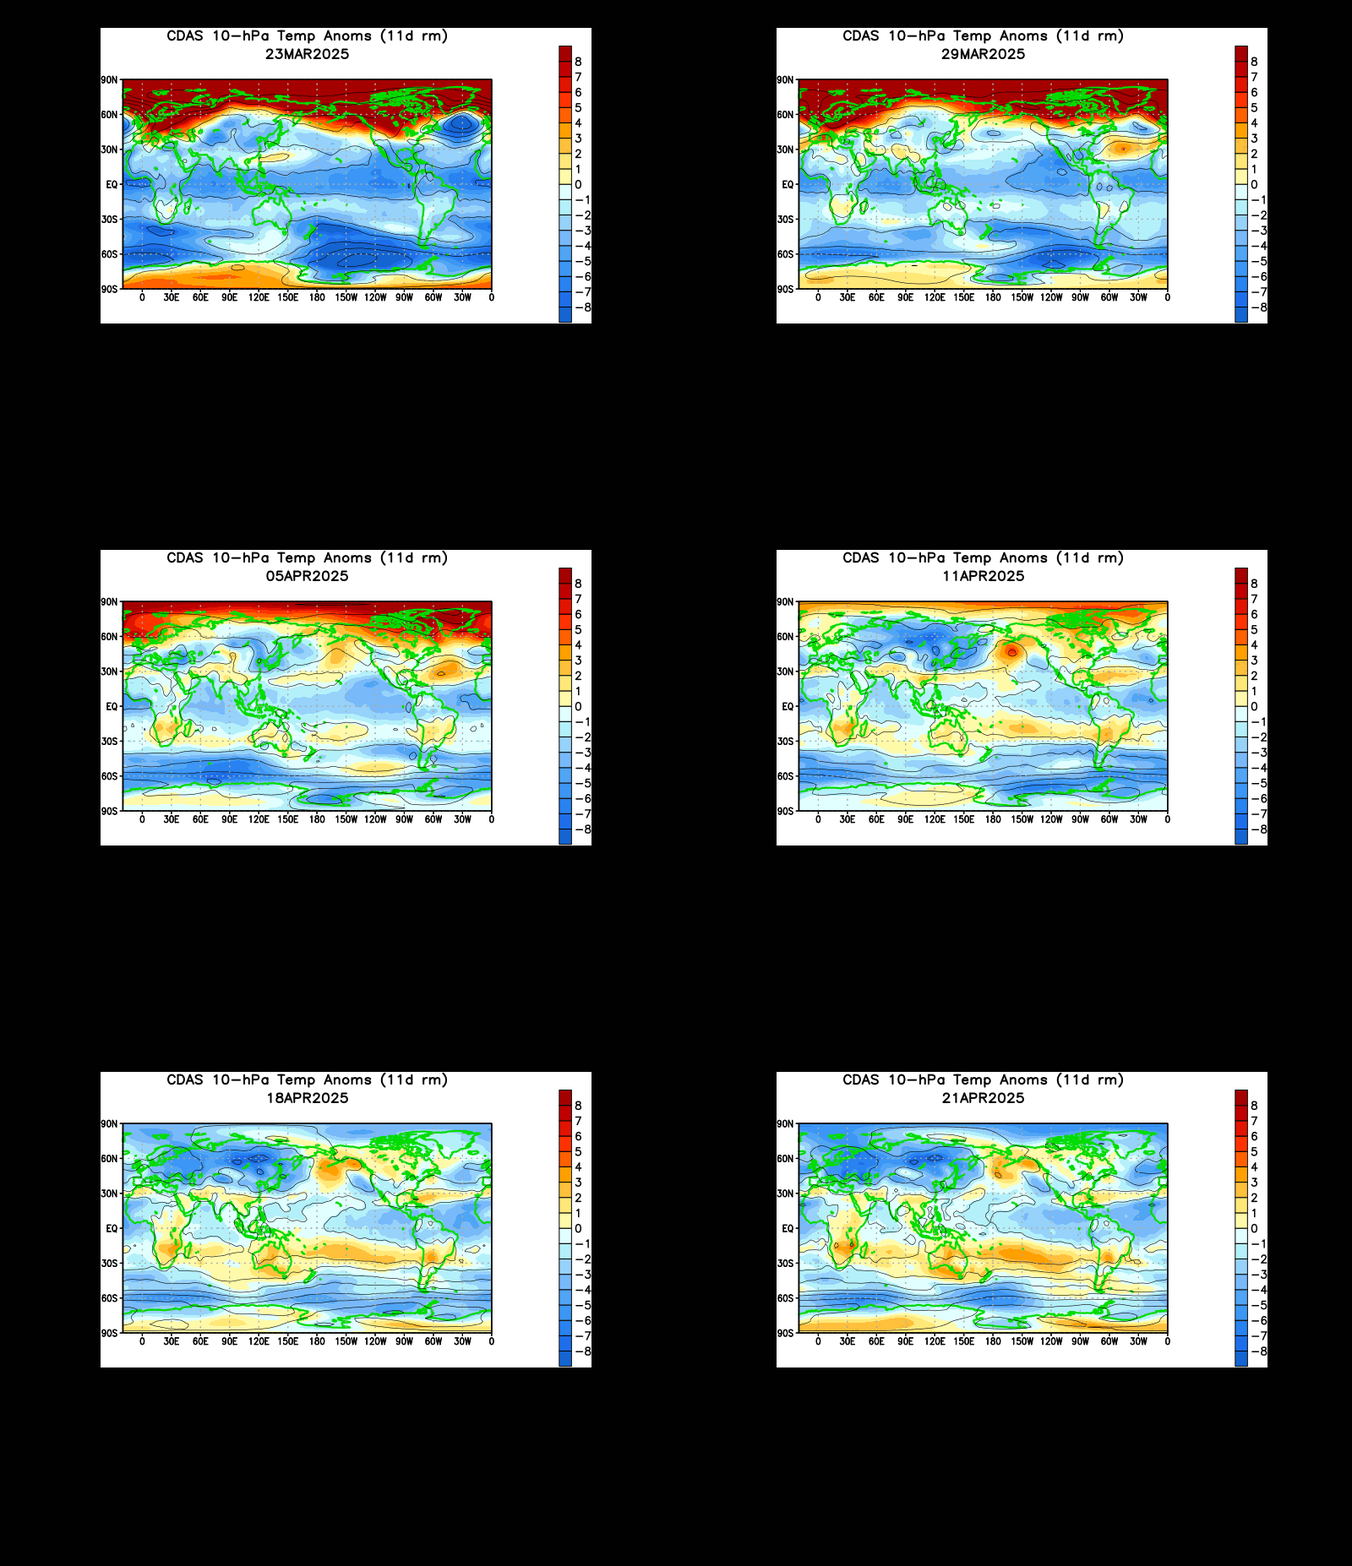
I have been saying that the polar vortex is looking unstable, that it will sustain heavy damage, but I am now putting out the call that the polar vortex will suffer a breakdown in coming weeks.
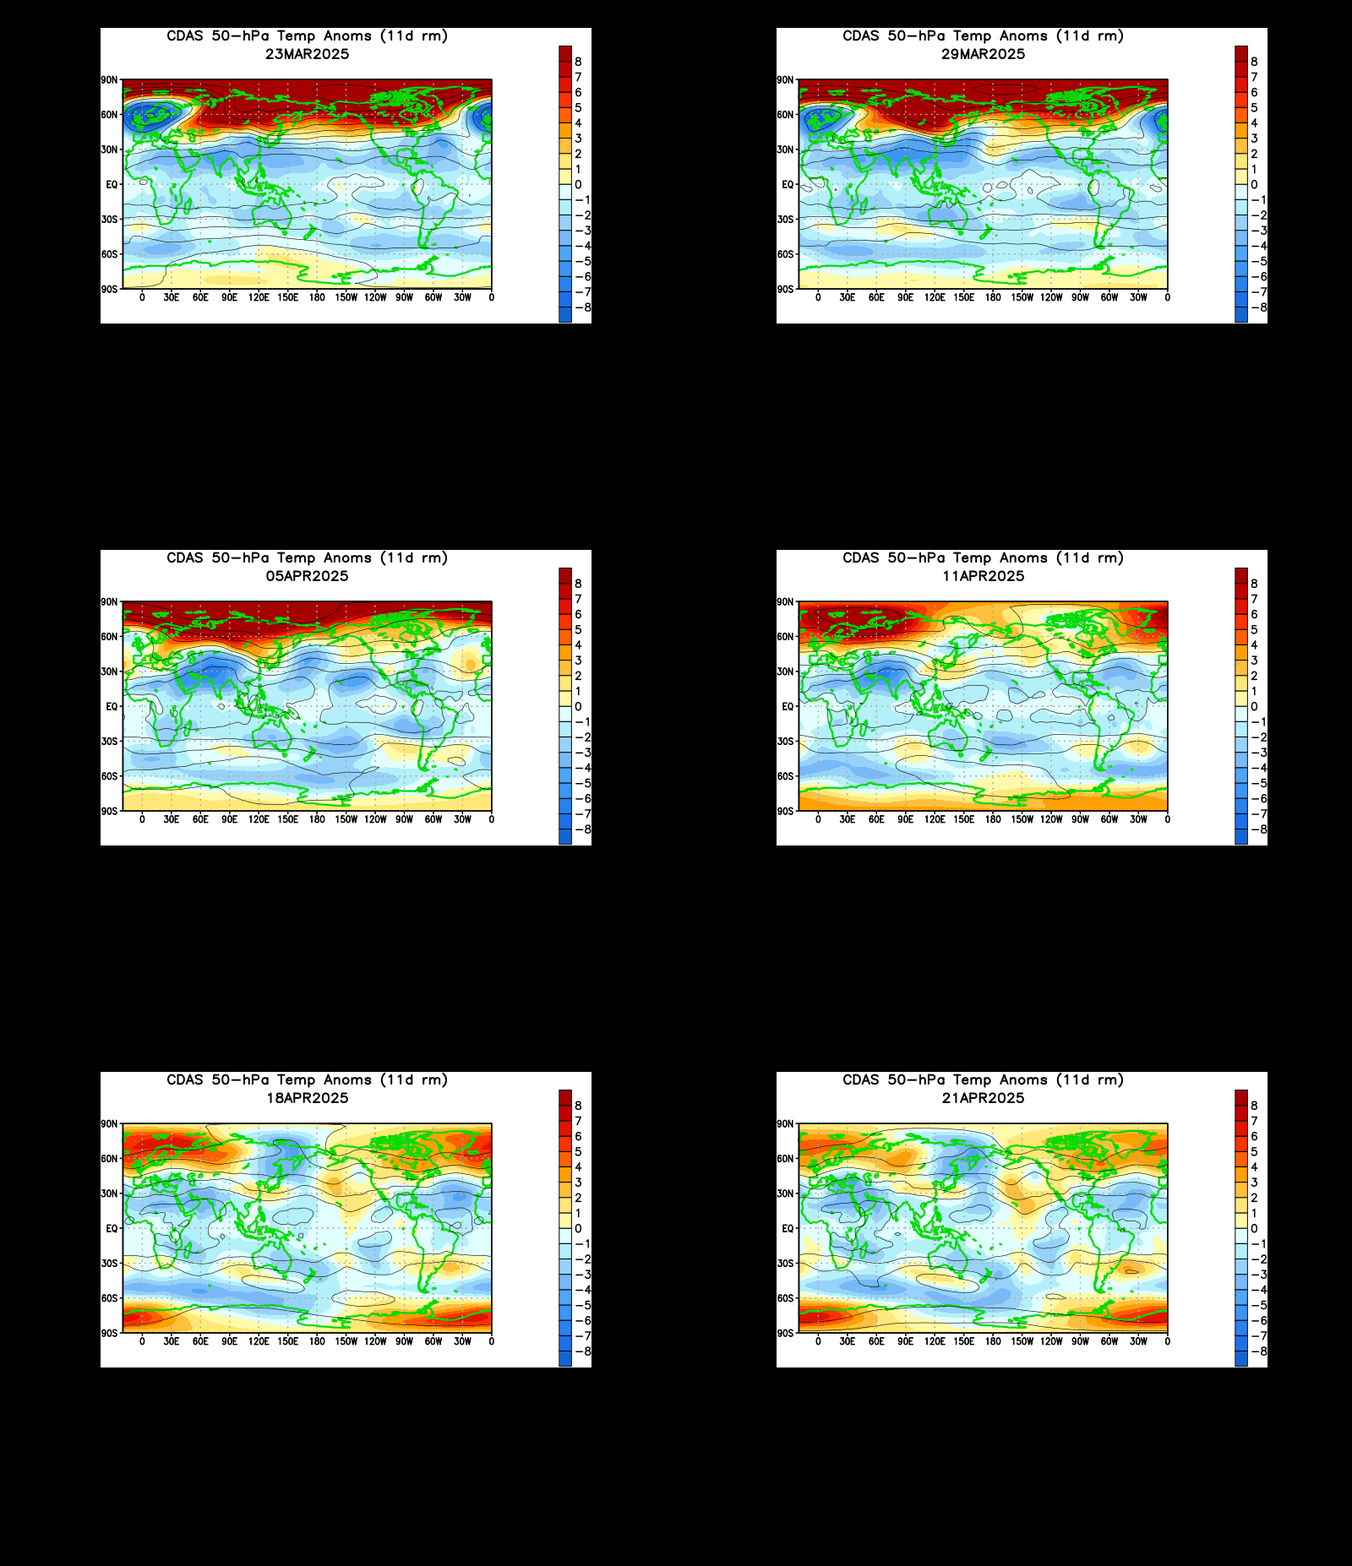
 A 50mb animation of temperature anomalies shows we are seeing that sudden stratospheric warming (SSW) ongoing across Canada and the Arctic at this time. This comes after a previous SSW in the opening days of December. But I want to point something out. Watch the last few frames of this animation. See how that warming starts to propagate towards Japan? This could be a second warming that may strike as the current warming is ongoing. Based on how the Japanese warming cell's contour lines are expanding northeast towards the ongoing SSW, I see reason to believe this Japanese cell of warming may also move towards the Arctic and strengthen the ongoing SSW.
Here's what I want to watch as far as model forecasts go. I am staying with the ECMWF model today out of confidence over the GFS, and because it displays information better than the GFS. Let's start with the far upper stratosphere.
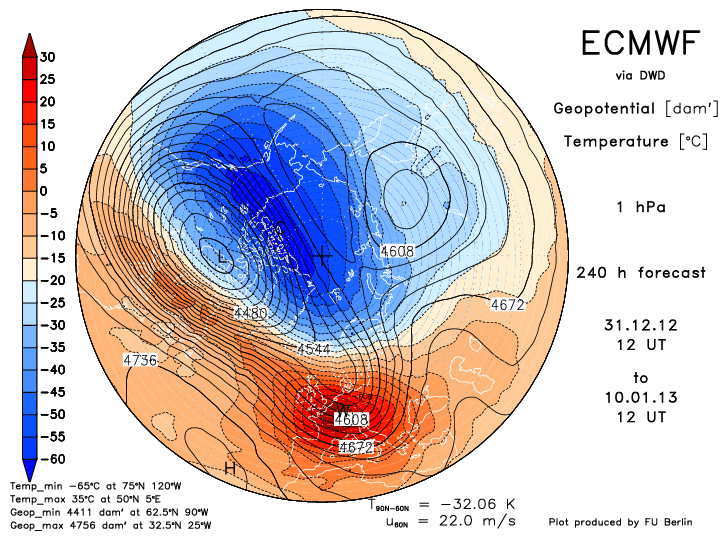
 This is the 1 millibar forecast for the stratosphere over the Northern Hemisphere. The US is on the left side of the image; you can make out the shape of Alaska in dark blue. I want to point out the main attraction, the big red blot over Europe. This is the warm air from the SSW. It is doing significant damage to the polar vortex, as I went back a few forecast timeframes and found significant weakening with every 24 hour image. This confirms my theory that the polar vortex will most likely collapse in the upper stratosphere first, if there is a stratosphere collapse to be had.
I'll show these next two images together due to their similarities.
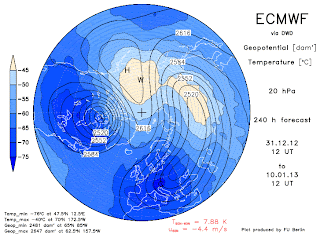
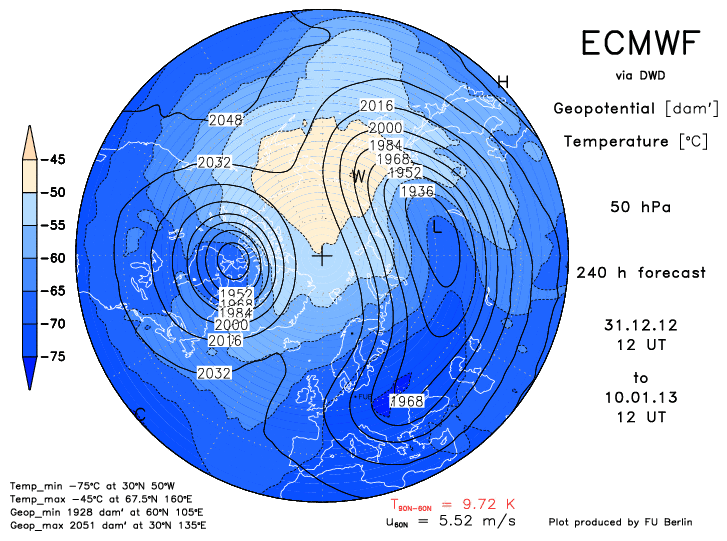
 The top image is the pressure and temperature forecast at 20 millibars, and the bottom image has the 50 millibar forecast. We want to pay close attention to the pressure lines here. Both images show two areas where there are multiple enclosed circles and/or ovals. These are daughter polar vortices. They signify that the main polar vortex has split and made multiple daughter cells. In both images, one vortex is over Canada and the other covers Eurasia. The reason these two images are significant is because the vortices are so far apart, and the split is so massive that I find it hard to believe the polar vortex can fully recover from this. The vortex is on its knees at this point- one more good SSW and collapse of multiple stratospheric levels of the polar vortex appears probable.

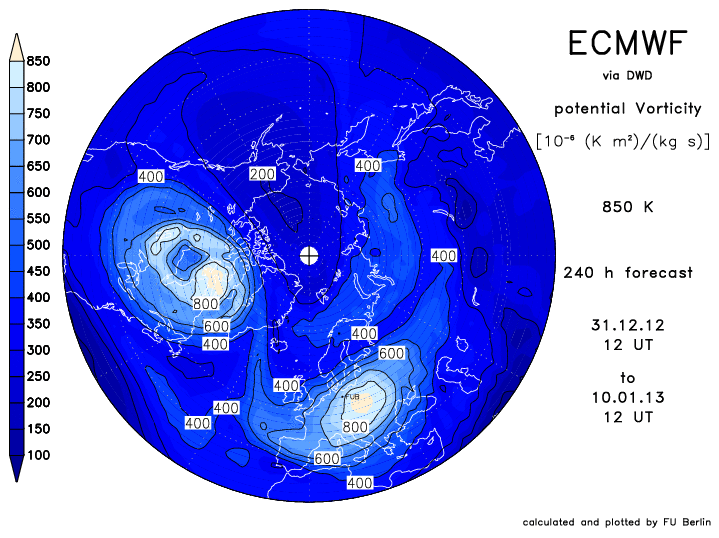
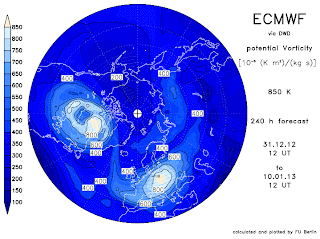 The last two images to show involve potential vorticity, or PV. In areas of raised PV, low pressure systems are commonly found, in this case the polar vortex (vortices). The top image shows presumably the PV values for the middle of the stratosphere, while the second image shows PV values for the upper stratosphere. Let's analyze the upper stratospheric image first (bottom image). We see two areas of slightly raised PV, indicating two daughter polar vortices. But they are so weak that they don't even constitue themselves to be fully-functioning polar vortices. This is what I call a good collapse of the polar vortex.
As for the top image in the mid-stratosphere, we see one compact vortex and one elongated vortex. The compact vortex is placed in Canada, meaning very cold conditions can be expected in that nation come late January-early February. The elongated polar vortex is the superior one here, but is gradually weakening per review of multiple forecast hours at this same stratospheric level. I believe weakening should continue with both polar vortices, seeing as even lower PV values are trying to funnel in the space between the two vortices. If that happens, the chances of reconciliation between the two vortices becomes lower, the chances of a collapse are raised.
 The last image to show is a zonal wind forecast for Day 10, the same forecast time as the other forecast images. Here, we see three items of interest: 1) the oranges and reds in the middle of the image, 2) the blues in the right corner of the image, and 3) a finger of blues between the numbers 30 and 100 on the far left side of the image.
(1): The oranges and reds suggest winds in the stratosphere that are favorable for polar vortex formation and sustainment. The winds in the stratosphere are working to hold the vortex together in the areas where there are oranges and reds. The warmer the color, the more favorable the winds are to polar vortex sustainment. This spread of oranges used to cover the entire image, but has now eroded in the face of our next item of interest.
(2): There is a large body of blues in the upper right hand corner of the image. This signifies winds that are working against formation of the polar vortex. These unfavorable winds form when a sudden stratospheric warming occurs, as the entire purpose of the SSW is to disrupt favorable polar vortex winds and insert unfavorable winds in its place. These blues have been eroding as time goes on from Day 7 to Day 10 forecast time period, but the polar vortex favorable winds have also been eroding, meaning the potential breakdown's chances are on the rise.
(3): That finger of blues between the 30 millibar area and 100 millibar area shows yet another wind-based phenomenon in the stratosphere called the Quasi-Biennial Oscillation, or QBO. In a negative QBO, one encounters winds that are unfavorable to sustainment of the polar vortex, while the positive QBO brings about favorable polar vortex winds. Considering that finger of blues exists in the regions mentioned, I find a negative QBO to be in existence, another piece of the puzzle detrimental to the polar vortex.
In summary, the polar vortex is definitely taking multiple hits and will experience collapse in the upper stratosphere if these forecasts verify. If the split in the polar vortex continues and even strengthens, we could see a collapse in the middle and lower stratosphere later on in January, which would then make for a cold February. I will discuss that at a later date.
Andrew
Here's what I want to watch as far as model forecasts go. I am staying with the ECMWF model today out of confidence over the GFS, and because it displays information better than the GFS. Let's start with the far upper stratosphere.
I'll show these next two images together due to their similarities.


As for the top image in the mid-stratosphere, we see one compact vortex and one elongated vortex. The compact vortex is placed in Canada, meaning very cold conditions can be expected in that nation come late January-early February. The elongated polar vortex is the superior one here, but is gradually weakening per review of multiple forecast hours at this same stratospheric level. I believe weakening should continue with both polar vortices, seeing as even lower PV values are trying to funnel in the space between the two vortices. If that happens, the chances of reconciliation between the two vortices becomes lower, the chances of a collapse are raised.

(1): The oranges and reds suggest winds in the stratosphere that are favorable for polar vortex formation and sustainment. The winds in the stratosphere are working to hold the vortex together in the areas where there are oranges and reds. The warmer the color, the more favorable the winds are to polar vortex sustainment. This spread of oranges used to cover the entire image, but has now eroded in the face of our next item of interest.
(2): There is a large body of blues in the upper right hand corner of the image. This signifies winds that are working against formation of the polar vortex. These unfavorable winds form when a sudden stratospheric warming occurs, as the entire purpose of the SSW is to disrupt favorable polar vortex winds and insert unfavorable winds in its place. These blues have been eroding as time goes on from Day 7 to Day 10 forecast time period, but the polar vortex favorable winds have also been eroding, meaning the potential breakdown's chances are on the rise.
(3): That finger of blues between the 30 millibar area and 100 millibar area shows yet another wind-based phenomenon in the stratosphere called the Quasi-Biennial Oscillation, or QBO. In a negative QBO, one encounters winds that are unfavorable to sustainment of the polar vortex, while the positive QBO brings about favorable polar vortex winds. Considering that finger of blues exists in the regions mentioned, I find a negative QBO to be in existence, another piece of the puzzle detrimental to the polar vortex.
In summary, the polar vortex is definitely taking multiple hits and will experience collapse in the upper stratosphere if these forecasts verify. If the split in the polar vortex continues and even strengthens, we could see a collapse in the middle and lower stratosphere later on in January, which would then make for a cold February. I will discuss that at a later date.
Andrew


.gif)