Tuesday, August 6, 2013

2013-2014 Winter Update: Don't Worry, Be Happy

Concerns over a recent switch by the CFS model from showing a cold East US winter to an average/slightly above normal winter are unwarranted, and the main reason why unveils five reasons to be excited about this winter.

The Big Picture
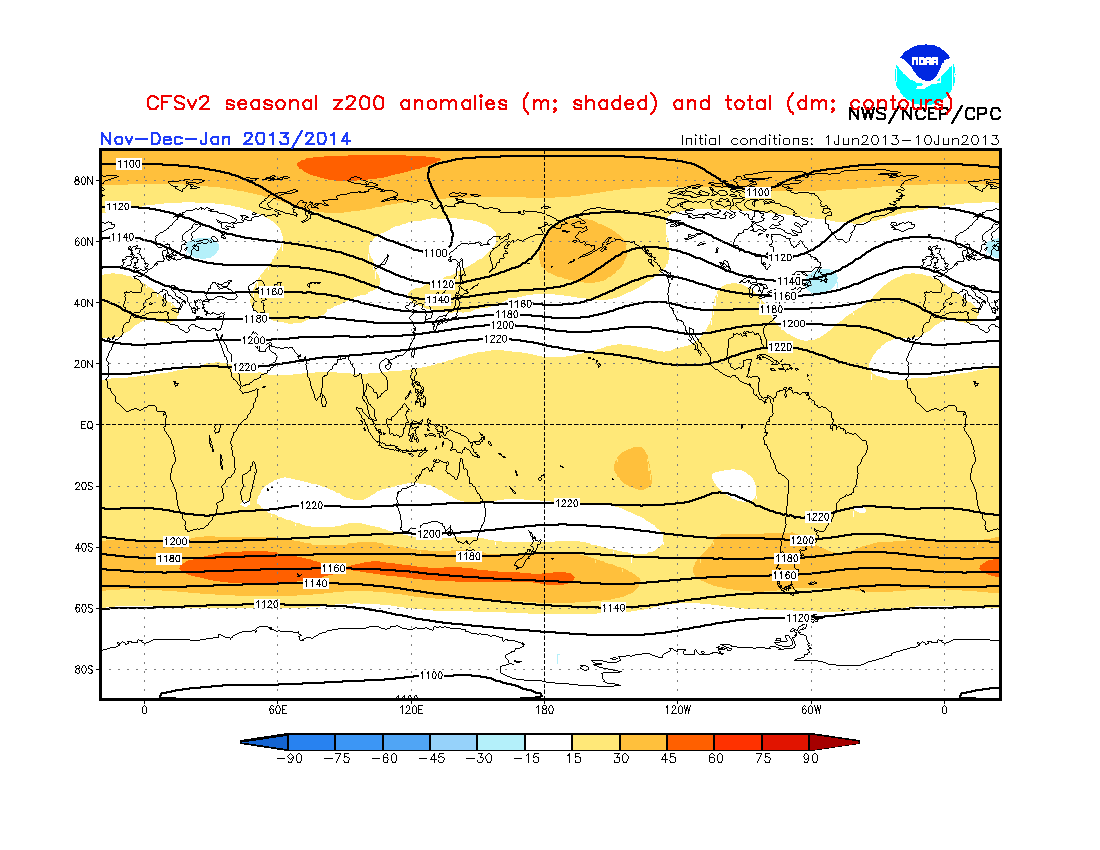
Many people are up in arms over the latest CFS model forecasts for this winter trending from a brutally cold US winter to a rather average, or even slightly above average winter in the temperature department. These are the times when people tend to show a different side- the side that tells a forecaster he/she was wrong about the CFS forecast when they posted how it was advertising a cold winter. People can get particularly nasty towards forecasters who don't deserve it. I posted about the CFS cold trend; luckily, all of you are polite folk who haven't thrown around vulgar comments like I've seen other forecasters get as a result of this sort of situation, when a model suddenly changes its forecasts. But I'm going off on a tangent now. The big picture here is that the CFS really has not changed its forecast as far as the atmospheric pattern goes. While temperature forecasts may have changed, it's pretty apparent that the CFS remains steadfast on a favorable mid/upper level atmospheric flow for the upcoming winter. You will see in the image above that I have five areas of interest numbered from 1 to 5. Each area of interest will be described below.

1. Active East Asian Jet Stream
You will see a tightening of the contour lines in eastern Asia on the image above, under the number 1. This symbolizes the jet stream is under stress, thus increasing its strength in that area. From looking solely at the image above, it would appear pressure anomalies are below normal in East Asia, meaning more storms in that region. If you have been with this blog for a while now, you may recall the times I have brought up a correlation between storms in East Asia and storms in the East US 6-10 days later. If the tightening of the jet stream in E. Asia is due to a stormier pattern in that area, it is entirely possible we see a stormier East US. Let the record show that the CFS has been adamant with this particular item for some time now: November-December-January 200mb forecast from June 2013

2. Ridging Pattern in Northern Pacific
It is well established that the Bering Sea is a favorite place for the origination of sudden stratospheric warmings (SSW's), a phenomenon that involves rapid warming in the stratosphere that then allows unusually cold air to reach the surface and lower latitudes just a couple of weeks later. Last winter, we saw a magnificent SSW originate from the Bering Sea, and other warmings attempt to take place in that same vicinity. With positive height anomalies stationed over the Bering Sea, intrusions of warm air by these positive height anomalies into the Arctic are more easily accomplished, thus increasing the likelihood of SSW events. Once again, this feature has been displayed on CFS forecasts for multiple months now, as the above link depicts. Additionally, bear in mind that these features were in the forecast when the CFS was projecting a very cold winter. In my opinion, it could very well be that the CFS is flopping around with its temperature forecast, as is customary of long range models, while the upper level atmospheric flow really tells the story (i.e. the pattern really is favorable for cold weather, even though temperature forecasts do not reflect it).

3. Ridging Pattern in Western North America
The image at the top of this post displays a widening of contour lines under the number 3. When you get the expansion of these lines, it is typically demonstrative of high pressure anomalies present in the area. The presence of high pressure anomalies in Western Nor. America is defined as a positive Pacific-North American index (PNA) pattern. In response to high pressure in the West US, low pressure (and thus cold air) is favored in the Central and East US. It is also known that a positive PNA results in winter storms taking a track favorable for the Midwest/Ohio Valley to receive snowfall. Yet again, the June CFS forecast identified the +PNA pattern for this winter, just as the current forecast shows.

4. Low Pressure in Eastern North America
This is kind of an extension of Number 3, in the sense of a low pressure response to positive height anomalies across the West US due to the positive PNA pattern. The CFS is picking up on those low pressure anomalies, though the model is reluctant to allow the anomalies to stretch into the United States. My theory on this is that, because the model is showing a forecast averaged out over 3 months, low pressure anomalies/cold weather DOES make it into the US due to the +PNA pattern. The reason why the model may be reluctant to do that on the image above is because we could see high pressure in the Bering Sea work against development of the +PNA pattern, thus preventing low pressure anomalies from reaching the US.

5. High-Latitude Blocking Pattern in Greenland
The image above shows an expansion of contour lines towards Greenland, an indicator that high pressure anomalies are favored in that area. Positive height anomalies in/near Greenland results in the negative phase of the North Atlantic Oscillation. The North Atlantic Oscillation (NAO) is a phenomenon that involves height anomalies across Greenland. In the negative NAO, high pressure is stationed over the land mass in a move that permits cold air and Nor'easter's to affect the Eastern US. On the other hand, a wintertime positive NAO results in a warmer United States with lower probabilities of big snowstorms for the nation as a whole. I brought about the theory that averaging out three months in a forecast may not project the real picture, and that theory also applies here. It applies here in the sense that the NAO may be very negative at times, but may also be less negative during some times. The tendency for a more negative NAO over a less negative/more positive NAO for this three month period in winter may then lead to pressure anomalies averaging out positive over Greenland (a sign of the negative NAO), thus showing an expansion of contour lines towards that region.

As the title of this post says, don't worry, be happy. Concerns over the increasingly-warmer CFS forecast for this winter are unwarranted on the basis that the mid/upper level air pattern has been steadfast throughout the last few months, including the time when the CFS was calling for a brutally cold US. The five points I discussed above have been steadfast in the last few months, and those same five points, when in place during the winter, do tend to set up a favorable pattern for cold and snow in the US area east of the Front Range.

Andrew

Sunday, August 4, 2013

Tropical Cyclone Generation Likely in Caribbean in A Few Days

Ensemble forecasts are indicating the chance of tropical cyclone generation in the southern Caribbean is skyrocketing in the next 5-10 days.

The image above shows the probability of a tropical cyclone forming in the timeframe from 5 days' forecast to 10 days from now. As the graphic above shows, there is higher than a 90% probability that we will see tropical cyclone formation in the waters just north of Panama in this timeframe. Based on the tracks listed on the image, it appears any cyclone that does form in the waters immediately near Panama would drift west and cut through Central America before transitioning to the East Pacific basin.

After the medium range development chance, things still look to be trying to get going. It appears tropical waves coming off of Africa may try to make another shot at development, but we're still a good 2 weeks+ away from that potential.

Andrew

Friday, August 2, 2013

Saharan Air Layer Puts Hold on Tropical Activity


Dry air has moved off of Africa as part of the Saharan Air Layer, resulting in lowered chances for tropical activity over the next several days.

In recent days, an intense layer of dry air has shifted west from Northern Africa, resulting in not only stunning satellite images, but also a decreased chance for tropical development in the eastern Atlantic and for tropical waves coming off of Africa. I anticipate that we should see this outbreak of dry air dissipating over the next week or two, which should allow tropical waves over Africa a better chance for tropical development.

Model guidance indicates chances of tropical development will increase after the 5 day mark from today, which is roughly the time we will see the dry air moving further through the Atlantic and dissipating in the process.

Andrew

Monday, July 29, 2013

2013-2014 Winter Update: Polar Vortex Likely to be Anomalously Weak This Winter

The polar vortex, a tight low pressure system in the Arctic Circle whose strength determines how much cold air North America may receive in the winter, appears to be headed for a weaker than normal stature this winter.

Two factors are contributing to this new development: the QBO and the stratosphere.

The QBO, also known as the Quasi-Biennial Oscillation, is an atmospheric oscillation that has a positive and negative phase. In the positive phase, a certain wind pattern in the stratosphere enhances the polar vortex, which in turn restricts cold air that may move to North America. On the other hand, the negative QBO permits a weaker polar vortex, resulting in more opportunities for cold weather in the winter.

This image may look a little intimidating, but bear with me, I'll explain it. This chart, developed by Mike Ventrice, shows eight different phases the QBO can take. As is shown on the left and right sides of this diagram, Phases 7, 8, 1 and 2 tend to be associated with the Easterly (Negative) QBO, while Phases 3, 4, 5 and 6 correspond with the Westerly (Positive) QBO. As the chart tells, we are in the mature stage of this positive QBO, something winter weather lovers don't want to see when winter comes around. I posted a few days ago about how the positive QBO is surviving in a very hostile environment, and this should allow the mature +QBO to stay close to the circle in the middle of the chart (this circle indicates the QBO is too weak to be in a certain phase) as it progresses into Phases 6, 7 and 8 by late fall. When November rolls around, I expect the QBO to be transitioning to a negative phase, which will give the green light for a weaker polar vortex.

While the QBO is in kind of a wait-and-see mode for when/if it will move to its Easterly (negative) phase, the current lower stratosphere temperatures are already hinting at a weaker than normal polar vortex this winter.

This image shows past observed temperatures at the 70 millibar level in the stratosphere; considering the stratosphere runs from the 100mb level to the 1mb level, these temperatures are considered to be in the lower stratosphere. Looking at the most recent plot of the red line (observed temperatures), we see it to be above the green dashed line, which defines the average temperature for that time of year. This means the stratosphere is running warmer than normal this summer. A warmer than normal stratosphere in the winter means the polar vortex is favored to be weaker than normal- in the same sense, below normal stratospheric temperatures would favor a stronger than normal polar vortex, and thus fewer opportunities for cold weather in lower latitudes of the northern hemisphere.

When looking at past years with stratospheric temperatures comparable to what we have seen this past spring and into summer, the following years came up:

-2003
-1997

So, I took a look at the winters of 2003-2004 and 1997-1998 in the stratosphere. Both winters had rather significant stratospheric warming events in the early winter, with warmings continuing into the later winter. This bodes well for the idea of a weaker than normal polar vortex this winter.

A new item I found was how the winter stratosphere (December-January-February) tends to reflect stratospheric height anomalies in the summer months (June-July-August).

Analysis of the geopotential height anomalies for the stratosphere from June 1 to July 26 shows a very strong tendency for positive height anomalies over the Northern Hemisphere. The strongest positive anomalies are observed over northeast Asia into Alaska and the Bering Sea. Lower height anomalies are displayed over Greenland and into eastern North America. While this summer to winter stratosphere correlation does not necessarily keep location in mind, the general gist you can get out of this image is that we are likely going to see positive height anomalies (high pressure) battling the polar vortex during the upcoming winter, aiding in the bid to weaken the vortex. If we see these positive height anomalies continue through August, I will be more comfortable with this idea of a weaker polar vortex for the upcoming winter.

The QBO moving from positive to negative (if not neutral-negative), along with an already-favorable stratosphere, tells me the chances of an anomalously weak polar vortex are on the 'likely' side.

Andrew

Sunday, July 28, 2013

Tropical Wave Dorian Attempting to Re-Strengthen

Tropical wave Dorian (now classified as invest 91) is attempting to make a comeback, as overnight developments and new model guidance suggests we are not finished with Dorian just yet.

Satellite imagery above shows a recent sustained burst of convection around Dorian. This convection is evident by the persistent red and orange colors on the satellite loop above. In recent satellite scans, it would appear this convection is weakening, but the fact that this tropical wave has gathered itself after a collapse from tropical storm status is impressive.

A pass from the ASCAT system, which determines wind speed and direction via satellite, has found the tropical wave with a better developed center than what it had about 12 hours ago. This is no major circulation by any means, but it is clear that there is a center associated with Dorian- whether it continues to refine itself is to be determined, but I have little doubt that the increasing convection and better-defined center of circulation spells an impending strengthening of the tropical wave.

Track and intensity guidance has the tropical wave moving northwest in coming days before making a curve north, possibly hitting Florida in the process. The atmospheric flow for this tropical wave is supportive of a track curving north further out to sea, although as of 24 hours ago, the majority of the GFS Ensemble members favored a Gulf of Mexico track. All models pictured here indicate the invest will restrengthen into a tropical storm in just 24 hours, with all but one model projecting hurricane-status strength by the 96 hour mark. The invest will continue to move over relatively warmer waters than what it was over when Dorian had achieved tropical storm status, but it will also be moving through rather substantial shearing.

I think we will see Dorian reform into a tropical storm, but hurricane status is a little out of the realm of reason, in my opinion.

Andrew