Tuesday, January 9, 2018

January 10-12 Winter Storm

A winter storm is expected to impact the Northern Plains over the January 10-12 period.

ARL
As of this morning, a strong upper level low was located offshore California, moving into the Southwest. In addition, a piece of energy was located moving onshore just north of the Pacific Northwest. These two features will combine to create an accumulating snow event for portions of the central U.S. in the next couple of days.

ARL
By Thursday morning, this upper level low is forecast to have moved into the Central U.S. and separated into two primary parts - the majority of the energy is projected to take the form of a positively-tilted trough, bottoming out in western Texas, while a smaller part of the low will break off and ride the ridge over the Ohio Valley to become negatively-tilted. At the same time, that small piece of energy we currently see moving along the U.S. / Canada border near the Pacific Northwest will help to pull that smaller piece of energy northward and help give it that negative tilt to create the winter storm for the Plains.

Tropical Tidbits
Also on Thursday morning, the winter storm is projected to be ongoing for the Plains, with a surface low located along the Iowa / Wisconsin border producing a band of accumulating snow from Kansas to Minnesota and the northern portions of Wisconsin. The GFS model portrays a sliver of precipitation to fall as sleet or perhaps freezing rain, but due to how conditions must be "just right" for freezing rain to occur, and to some extent also for sleet, the location and intensity of either freezing rain or sleet will likely only be accurately known just before the event begins. Rain is expected to fall and chip away at any enduring snowpack in Iowa, Illinois, Michigan, southern Wisconsin and parts of Missouri.

Pivotal Weather
Snow accumulations are expected to be maximized along a bad from central Kansas through eastern Nebraska, northwestern Iowa and southern Minnesota, with a stripe of particularly-heavier accumulations forecasted from southern Minnesota through northern Wisconsin and the upper peninsula of Michigan. Light snowfall is possible in the wake of the storm system as colder air filters in behind the low, resulting in the 1-2" accumulations depicted across southern Wisconsin, northern Illinois and parts of Iowa and Missouri.

The snowfall in the primary axis of heavy snow is expected to be of the heavier and wetter kind, as opposed to the light & fluffy snowfall seen from Alberta Clippers. As such, if you reside in an area expecting accumulating snowfall from this storm, be sure to take frequent breaks if you decide to shovel, and to not exert yourself when doing so. Snowblowers are often the best idea for moving substantial accumulations of this kind of heavy, wet snow.

To Summarize:

- A winter storm is expected to affect portions of the Central U.S. between January 10th and January 12th.
- Accumulations of 6-9" are expected in a band extending from central Kansas through eastern Nebraska, western Iowa, southern Minnesota, northern Wisconsin and the upper peninsula of Michigan.
- This snow is expected to be more akin to heavy, wet snowfall than lighter, fluffier snowfall. As such, take precautions when shoveling snow, and use a snowblower or plow if possible.

Andrew

Long Range Outlook: January 9, 2018

This is the long-range outlook, published on January 9th, 2018.

I'll begin with a topic that I've discussed a few times on this blog since November 2017: that of the stratospheric warming event that unfolded in December.

JMA
Shown above is a line graph showing the 30-millibar level temperature from September 2017 to the present day. I had highlighted how a stratospheric warming event appeared imminent in late November, though as mentioned this was not expected to be a sudden stratospheric warming (SSW). This is what transpired, though this warming event was prolonged and came in a number of waves after the initial failure of the first wave of warmth to penetrate the stratospheric polar vortex in the Arctic Circle. As the above graph shows, however, the warmth did eventually make its way into the stratosphere, weakening the stratospheric polar vortex and delivering the colder than normal temperatures to the eastern 2/3rds of the country to kick off the new year, as pictured below.
ESRL
Following the stratospheric warming event, the warmth in the stratospheric levels of the Arctic Circle has dissipated, leading to the sharp drop in the 30-millibar temperature that has reversed only recently, though still remains well below normal. Similar to how a warming event in the stratosphere can lead to cooler than normal weather in the eastern 2/3rds of the country roughly 2-3 weeks later, a rapid cooling of the stratospheric Arctic Circle region can encourage warmer than normal temperatures in the United States, as the colder than normal air becomes "locked up" in the upper latitudes. We'll get to the forecasts for the medium-range shortly to see if this does end up being the case.

For the time being, though, the Pacific is showing some very interesting features that I'd like to review.
CPC
Above is a four-panel graphic showing the global orientation of 200-millibar wind speeds (color fill) and geopotential heights (contours) in five-day periods, from December 18th to the present day. From the five-day period including Christmas Day to today, the Pacific jet stream has strengthened and become extended to the waters due south of the Aleutian Islands. A rule of thumb when observing the Pacific is that an extended jet stream can portray the threat of a storm system in the following days, and this does appear to be the case for this week, but will require a post of its own. For now, it is worth noting the extended nature of the Pacific jet stream, as this will more than likely lead to an opportunity for unsettled weather in the U.S. in the next two weeks.

Let's now take a look at one of my favorite longer-range graphics to watch, the 8-10 day geopotential height anomaly forecast from the three primary global weather models.
PSU
The ECMWF model's forecast for 8-10 day geopotential height anomalies is shown on the left-most panel, with the GFS model's guidance in the middle panel. The CMC (Canada's global weather model) provides its outlook in the right-most panel.

The three models certainly have some key differences in the projected pattern for the eight to ten day period, but there are a few similarities to be gleaned from the guidance. For one, all three models indicate the presence of a Rex Block in western Canada into Alaska and the Gulf of Alaska, albeit to varying magnitudes. The GFS is most pronounced with this pattern, producing a 'textbook' Rex Block in the form of the strong, cut-off ridge over a portion of the Arctic Circle and Alaska, as well as the negative anomalies in the Gulf of Alaska, offshore the Pacific Northwest. One could argue the actual Rex Block is formed with that ridge and the apparent upper level low over north-central Canada in the GFS panel, but such an orientation (slanting to the southeast, from the ridge to the upper level low) is rather unorthodox.
The ECMWF and CMC generally agree with the idea of the Rex Block, though neither model cuts off the ridge as the GFS does, instead setting up a positive-PNA-looking ridge from the American Rockies into a portion of the Arctic Circle, as one continuous ridge. Both the ECMWF and CMC still appear to support this as a Rex Block, however, with the zonal downstream flow in the United States, save for the waters just offshore of New England, where a suppressed ridge holds in place as a consequence of strong negative geopotential height anomalies in Europe and a mixed North Atlantic Oscillation (NAO) pattern. Those two features will combine to discourage colder than normal air buckling south into the eastern two-thirds of the country, instead supporting seasonal temperatures.

It's not enough to simply eyeball weather models, however. We now turn our attention to the Madden-Julian Oscillation.
CPC
Above is the ECMWF model forecast for the Madden-Julian Oscillation (MJO), with the ECMWF ensembles displayed individually via the thin yellow lines. Although this forecast period began on January 1st and ends January 15th, more-recently issued forecasts still support the outlook of the MJO transitioning from Phase 2 to 3, and perhaps then to Phase 4, albeit at a weaker grade than the previous phases. As the screenshot below and on the right shows, from the Climate Prediction Center,
temperatures in the United States tend to be cooler than normal for much of the Central U.S. and the majority of the East U.S. during Phase 2 in the winter months. This follows the rule of thumb (portrayed by these same composites) that Phases 8, 1 and 2 of the MJO are most favorable for colder than normal and snowier than normal conditions in the eastern two-thirds of the country during the winter months. Similarly, Phases 4, 5 and 6 are most encouraging for warmer than normal temperatures in the United States for the winter months.

The expected movement into Phases 3 and 4 of the MJO by the middle of the month suggests warmer than normal temperatures for much of the United States around the same time period. This seems to go hand in hand with the three primary models' projections of the 8-10 day period, and indicates that the middle of the month (likely a little bit beyond the middle of the month) should be warmer than normal for much of the country. I expect the warmer than normal tendency to continue through the later part of January in part due to that rapid cooling in the stratosphere that was observed at the end of December, and will translate to the warmer than normal weather for the middle and end of the month.

But what should we be on the lookout for at the end of the month? Will the warmth continue, or will the cold return?

FU-Berlin
Just as this post began with the stratosphere, it will close out with the stratosphere. Above is a multi-panel forecast from the ECMWF model for different variables in the stratosphere. We will focus in on the top three panels to make some prognostications for the end of January and into early February.

The top panel shows observed zonal wind speeds at the 1-millibar level of the stratosphere - in other words, the strength of the far-upper stratospheric polar vortex. The 1-millibar level isn't as important as the 30-millibar or 50-millibar levels. As an example of this, it has not been uncommon for a warming event to occur at the 1-millibar level but not the lower levels of the stratosphere, resulting in the effects of that 1-millibar level not showing up in the troposphere. Regardless, it is useful as an early indicator of a weakening of the stratospheric polar vortex, which can then show up in weakening at other levels of the stratosphere. The black line shows the ECMWF forecast of the 1-millibar wind speed, and as the wind speeds strengthened with the rapid cooling of the stratosphere (indicating a strengthening of the stratospheric polar vortex, as is to be expected), they look to again weaken over the next couple of weeks, albeit still remaining well above levels that would imply a "weak" stratospheric polar vortex. If you're a 'glass half-full' person and enjoy cold weather, then this is a good sign. Personally, the weakening of the wind speeds from a projected 90 m/s to a projected 50 m/s at the end of the forecast period, while a notable change, isn't something to really pay attention to just yet. If the wind speeds continue to weaken, then it could be something to take note of, but for now the upper-stratospheric polar vortex looks set to remain in firm control.

A similar forecast is shown in the second panel for the 10-millibar zonal wind speed (blue line) and the 30-millibar zonal wind speed (red line), where a strengthening of the wind speeds is then followed by a weakening, though still to rather-elevated speeds. To make matters worse for those who are seeking some colder weather, both the geopotential flux and heat flux indicators in the third panel are set to significantly increase during the forecast period, usually a positive sign for those who want the polar vortex to weaken. However, if you've analyzed these graphs before, you'll note how the EP-flux on the bottom panel is pointing up and to the left, when looking at it two-dimensionally. Stratospheric warming events are most probable when the geopotential and heat fluxes are high (which is forecasted) and the EP-flux arrows are pointed directly up (which is not forecasted). As such, the stratospheric polar vortex looks set to keep the colder air locked up in the Arctic Circle through at least the second-to-last week of January, helping to severely hurt any chances of a sustained colder-than-normal pattern for the eastern two-thirds of the country through at least early February.

To Summarize:

- The recently-discussed stratospheric warming event has ended and has been followed by significant cooling.
- Atmospheric oscillations, the stratosphere, and medium-term weather model guidance agree on warmer than normal temperatures more likely than colder than normal temperatures in the eastern two-thirds of the country through at least mid-January.
- The stratosphere supports this likelihood of a warmer than normal weather pattern persisting into at least early February.
- A separate post on the potential for a strong storm system this week is forthcoming.

Andrew

Friday, January 5, 2018

Tropospheric Polar Vortex Dislodged, But Warmth To Prevail

Medium-range forecasts have the tropospheric polar vortex dislodged from the Arctic Circle, typically an opportunity for a colder than normal period in the United States, but model guidance foresees abundant ridging in the Rockies to disperse any such opportunities.

PSU
Both the GFS and ECMWF models, in their 8-10 day 500-millibar geopotential height anomaly graphics, show strong ridging pushing into the Arctic Circle, forcing pockets of cold air to lower latitudes. However, with a strong ridge over the Atlantic in a less-than-optimal position and a broad ridge over the Rockies just screaming to bleed east, any opportunities for cold weather look to be transient.

The ridge in the Atlantic looks to try and push northward, but an area of well below-normal geopotential height anomalies just east of Greenland will not only stop the ridge from moving north, but due to its positioning near Greenland will also promote conditions similar to the positive phase of the North Atlantic Oscillation (NAO). Such a pattern is conducive for warmer than normal conditions over the Central and Eastern U.S.

Also helping prospects for warmer than normal weather in the eastern two-thirds of the country is the ridge over the Rockies, something that may be recognized as the positive phase of the Pacific North American (PNA) index, but this is a 'false positive'. The 'passive' nature of this ridge, as seen in its relative weakness compared to the ridge over the Atlantic and the trough over the Aleutian Islands of Alaska, will let the Pacific jet stream just ride over the ridge and *not* proceed to plummet south into the Plains, as would typically happen in a +PNA set-up. Instead, it looks like the jet stream will be coerced into staying north, possibly even meandering in Canada in this timeframe, storing the colder air up there and in the three lobes of the tropospheric polar vortex, expected to be over the Aleutian Islands, northwest Europe and northern Eurasia.

In the longer-term, prospects for sustained colder than normal weather look similarly-cloudy, with model guidance foreseeing the Madden-Julian Oscillation (MJO) transitioning to Phase 4 by the middle of the month. Phases 4-6 are notorious for encouraging warmer than normal conditions in the eastern two-thirds of the United States during the winter month, and as such, further shots of cold air may prove to be transient through the end of January.

To Summarize:
- Following the recent period of colder than normal weather, warmer than normal (if not seasonal) temperatures for much of the country are expected for much of the remainder of January.

Andrew

Thursday, December 21, 2017

Potential Christmas Day Winter Storm

There are some indications that the Northeast could see accumulating snow on Christmas Day.

Source: CoD
We begin by showing the 12z GFS model forecast for precipitation type and intensity, valid at 09z (4am Eastern Time) on December 25th. Note the presence of a storm system offshore of the Northeast, with the rain/snow line far enough offshore so that coastal areas look to receive primarily snow from this system, taking the GFS verbatim. The primary exception in this frame is the strips of land jutting out from New England, which look to at least begin this event with rain.

Source: CoD
Three hours later, at 7am local time, the storm system has intensified and is now bringing heavier snow to the same areas. It appears as if Connecticut, Rhode Island and Massachusetts look to receive the heaviest snow at this point in time, with accumulating snow also aiming for portions of New Jersey, New York and Vermont into New Hampshire. Again, extreme coastal areas near Massachusetts look to be receiving rain at this point in time.

Source: CoD
Our last frame brings us to 10am eastern time, and we see that the storm system has not only intensified further but brought the rain/snow line far enough east to transition the coastal regions of Massachusetts to all snow - and heavy snow, at that. By this time, as the storm system begins to move east, the heaviest snow looks to impact Massachusetts, Connecticut, Rhode Island and the Maine/New Hampshire/Vermont region, broadly. While accumulations in these coastal regions will likely be cut due to the earlier rainfall, a white Christmas does look to be in store for a good portion of the Northeast.

Source: Instant Weather Maps
48-hour accumulated snowfall by late afternoon on Christmas Day pinpoints accumulations nearing 6" for Connecticut and Massachusetts, with a broad 3-6" accumulation forecast for New York, Vermont and New Hampshire. Lake effect snowfall will likely tack on several more inches in western New York both during and after this storm system.

To Summarize:

- A potential winter storm looks to impact portions of the Northeast on Christmas Day.
- Accumulations of 3-6" are most likely at this time, with CT/MA/RI among the most impacted areas.
- Heaviest snowfall should begin falling in the aforementioned states in the early morning hours, and continue through the late afternoon.
- Prepare for significant delays, if you plan on traveling for the holiday.

Andrew

Wednesday, December 20, 2017

Potentially Significant Arctic Cold Outbreak To End December

Model guidance is beginning to hint at the potential for a significant blast of colder than normal air temperatures in the final days of December, and atmospheric oscillations appear to support such an outcome.

Source: PSU
We first take a look at the geopotential height anomalies at the 500-millibar level, valid in the 8-10 day forecast period. On the left-most panel, we see the ECMWF's forecast. The middle panel and right-most panel shows the GFS and CMC model forecasts, respectively. All models agree on the evolution of a ridge of high pressure blossoming over the Arctic Circle, which will force the tropospheric polar vortex to be displaced to lower latitudes.

Model guidance diverges in where the "strongest" piece of the polar vortex will end up, although with these longer-term forecasts such discrepancies are to be expected. The ECMWF model favors the strongest negative anomalies in western Europe, with lesser negative anomalies contained in southern Canada as that Arctic ridge becomes cut off from the mid-level flow. This results in a zonal jet stream (almost directly west-to-east) orientation, supported by some moderate ridging in the Pacific waters just west of the West Coast. This is the "warmest" of the three model forecasts.
The GFS and CMC agree that the Arctic ridge will not be cut off from the mid-level flow, and will instead force the jet stream far north. The CMC even goes as far as to propel a Rossby Wave (a very nice-looking, "textbook" one, at that) north through Siberia, helping to push that jet stream to the north and thus make the flow much more meridional ("wavy") in the mid-latitudes.
While the GFS keeps the deepest negative anomalies in western Europe, the absence of a cut-off flow means the jet stream buckles south and allows much colder than normal air to circulate around the northern third of the U.S. A slight ridge in the Atlantic also helps to push that lobe of the polar vortex a little further south in North America.
The CMC is undoubtedly the most severe of these three scenarios, combining a strong ridge over the Arctic Circle, a positive PNA-esque pattern and a stronger ridge in the Atlantic to shunt the deepest core of the tropospheric polar vortex into the United States, now affecting a good half of the country, at least. For the moment, I would side with the GFS solution, just as it's between the two extremes of a rather-nonchalant ECMWF forecast and a severe CMC forecast.

Source: PSU
A look at the individual GFS ensembles, as well as the mean top & center, shows a general consensus on cooler than normal weather affecting all of the country east of the Front Range by December 29th, with the coldest anomalies spotted in the Plains and Midwest, as well as southeast Canada. You see some more extreme solutions in there, as well as some more transient cold shots, and for this reason it's a good idea to go with the mean, which indicates cooler than normal weather is possible in this timeframe. Intensity will, of course, be forecasted more accurately in the coming days.

Source: PSU
By January 2nd, to kick off the new year, GFS ensembles again hint at a shot of colder than normal air for the eastern 2/3rds of the country. As you can see, however, there is considerably higher uncertainty with this one due to magnified discrepancies between ensemble members, so again we will opt to monitor this period simply for the potential of cooler than normal weather.

The models can be notorious for showing one thing while the opposite comes to fruition. Atmospheric oscillations & teleconnections appear to argue in favor of a GFS-like solution for the end of December, however.

Source: CPC
The GFS ensembles are shown above projecting the phase of the Madden-Julian Oscillation (MJO) through the first few days of the new year. Recall that the MJO is based on the strength and location of thunderstorms near the Indian Ocean and north of Australia, and each different phase signifies a different location of these thunderstorms.

Each different phase also has different effects for weather here in the United States. Note that Phases 8, 1 and 2 are most favored for cooler than normal weather in the central and eastern U.S., while Phases 4, 5 and 6 are favored for warmer weather. It just so happens that the GFS ensembles favor a Phase 8 or Phase 1 orientation of the MJO for this late December period, when models foresee colder than normal weather in the United States. It must be noted that other forecast models, such as the ECMWF and its ensembles, foresee weaker activity, to the extent that thunderstorm activity in late December is too weak to "officially" resemble a Phase 8 or Phase 1 orientation. In sum, while there are model discrepancies to be worked out, the MJO could very well be in a very supportive phase for this outlook of colder than normal weather at the end of the year.

Source: JMA
You may recall I talked about a warming event in the stratosphere nearly a month ago, which came to fruition while I was studying for finals. The results of that warming event are shown above in a graph of the 30-millibar temperature reading since September 2017, with the average value shown on that gray line.

Source: CPC
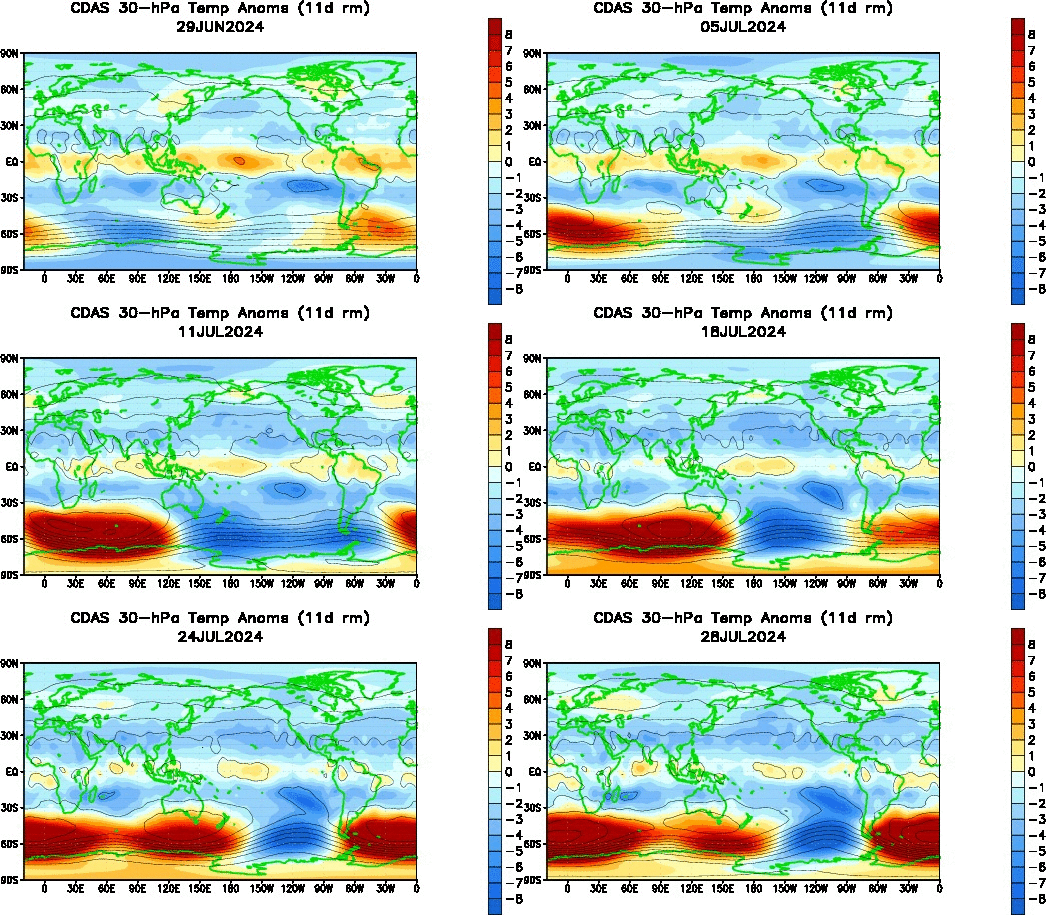
30-millibar temperature anomalies
As shown above, it seems that the main portion of that warming event did not come to pass until the early slice of the month, whereas I had expected it to occur at the end of November or perhaps the first day or two of December. Alas, if meteorology were a perfect science I wouldn't have any posts to write, because we would all know what would happen!

With the occurrence of that warming event around December 7th - December 12th, maximized in the December 10th - December 14th period, we could then extrapolate the tropospheric effects to become evident two to two-and-a-half weeks later. This puts us in roughly a December 21st through December 30th period for the first effects, which looks to verify per that three-panel forecast graphic at the top of this post. The effects could really become visible here in the troposphere around December 24th - January 1, 2018 period, going along that two to two-and-a-half week frame from the maximum warming. This general timeframe fits squarely in the eyes of model forecasts for some much colder than normal weather in the U.S., like we saw earlier in this post, and provides additional evidence that this blast of Arctic air may come to fruition, at least to some degree.

To Summarize:

- Model guidance is advocating a potentially significant outbreak of colder than normal weather in the eastern 2/3rds of the country for the last several days of December.
- While details (exact location, intensity of cold air, etc) remain to be figured out, atmospheric oscillations, including the stratosphere, appear to agree with this colder than normal weather event.
- This remains some time off. As such, while models like the GFS show high temperatures of -15 just west of Chicago, IL in this period (for example), we will see significant and dramatic change in such forecasts before we reach a more accurate projection.

Andrew