Tuesday, September 11, 2012

Atmosphere May Be Sabotaging El Nino; Robust Winter Prospects Affected

**First and foremost, this post is dedicated to the victims of the September 11, 2001 attacks at the World Trade Centers, The Pentagon, as well as Shanksville, Pennsylvania. Also in this dedication are the first responders and Good Samaritans who both did or did not survive this tragedy.**

New data has come to my attention that suggests that the atmosphere may be trying to sabotage El Nino at this time.

As I reported in an earlier post, the El Nino is on differing pages as for the sea surface temperatures and the atmosphere. The SST's are showing an El Nino is present, while the atmosphere is not positively responding to such a revelation. Let's take a look at what I have found.
Refresh page if animation stops
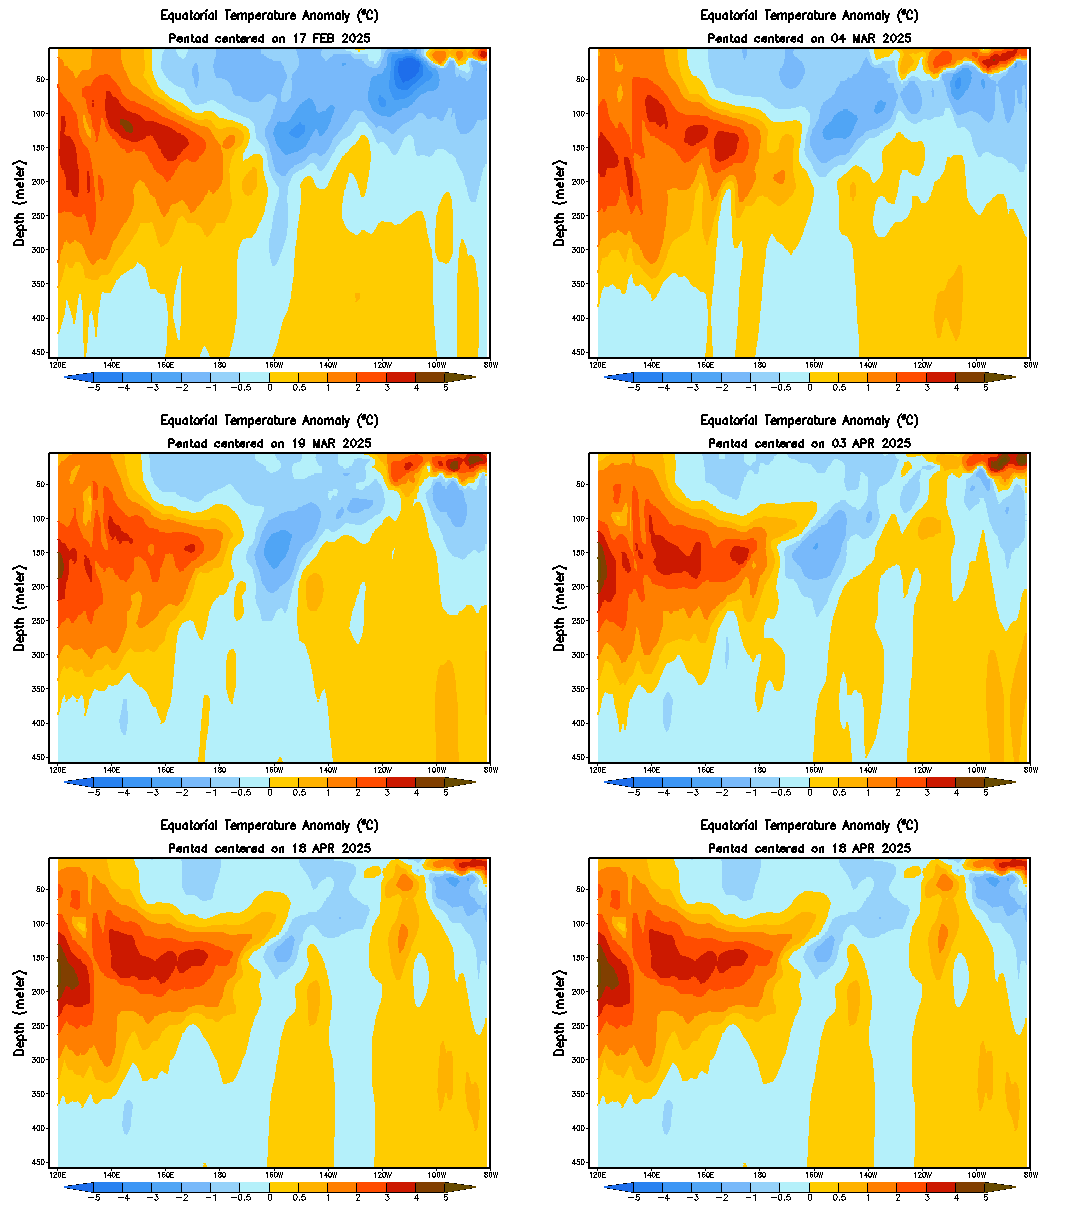
The animation above shows temperature anomalies in the Equatorial Pacific waters, specifically over the ENSO monitoring area. At the beginning of the animation, we can clearly see an El Nino progress upwards from deeper waters, specifically from the 200 meter mark. The main body of warmer waters is centered further to the east, making this a central-east based El Nino.
However, take a look at the last few frames. We can see the warm waters over the central ENSO monitoring regions actually dissipating, and cold water anomalies forming right below this. These cool waters are actually slightly strengthening, posing a big question as to how formidable this El Nino really is. Could the waters be turning on the El Nino in addition to the atmosphere? Will the El Nino even be around for winter? Let's take a look at what the atmosphere says on that subject.


Let's start with 850 millibar wind anomalies. Above is what an El Nino would bring in terms of 850mb wind anomalies to the world. We want to focus in on the equatorial Pacific, where we see above normal wind anomalies in the fall months. That said, if we were to be looking for a sign that the atmosphere is on board with an El Nino, we would want to see stronger than normal winds at the 850mb level. Let's take a look at what 850mb winds are looking like right now.


Latest observed wind anomalies in the region suggest there is nothing significant suggesting that an El Nino is present. The chart above shows pockets here and there of stronger winds, but by the slightest of margins- and they aren't even in the right places! The fact that there are no lower level winds that would be in line with that of an El Nino greatly concerns me, and concerns my confidence in the potential for an El Nino to take hold in the next several weeks.

We can even look at a larger scale of wind anomalies for the world as a whole, and these results only add to the confusion. In what an El Nino would show as normal to below normal wind anomalies in the extreme southern Pacific, the observed wind anomalies depict a much windier than normal environment in that region. Even the typically-calmer than normal winds in southern India in the midst of an El Nino are replaced by strong winds- a bad sign for the El Nino.

Moving on, we can also use something called the OLR, or Outgoing Longwave Radiation, to measure the ENSO phase. In a nutshell, when the OLR is positive, a La Nina is likely to be present. However, in the negative OLR, an El Nino should be found. Let's take a look at the latest observed OLR values for the last few months, as well as the values for the last several days.


Monthly oLR values over the past several months suggest a low confidence level of the atmosphere, with fluctuations from positive to negative being observed from late spring to the current time.  July did have a low OLR which would signal the presence of an El Nino, but August dashed those hopes, with a +0.2 OLR being observed.
Looking at the last few weeks, fears of an un-Nino like environment are confirmed. Throughout the past several weeks, a notable absence of negative OLR values was observed. Positive anomalies were even found where the El Nino should be, conclusive to a lack of atmospheric support to an El Nino.

But wait- There's More!

Courtesy of University at Albany student 'Carl'
The chart above shows precipitation anomalies currently. Typically, we would expect to see above normal precipitation anomalies both in the circled area and just to the north of the same circled area, where the El Nino appears to be based. However, there is no above normal anomalies in the circled region, and only scattered anomalies across the region shaded in orange and red. This lack of widespread precipitation poses a problem to the development of the El Nino. A continued lack of above normal precipitation would lead to additional concerns over how much influence this El Nino could have over the winter.

In conclusion, this new suite of data I have discovered has led me to believe that the atmosphere is not on the same terms as the sea surface temperatures. Additionally, underwater cooling of the same warm water anomalies is only building concern for how far the El Nino can go, especially into this winter.

Climate models are beginning to back off as far as the intensity of the El Nino goes. In my opinion, this is a very wise choice- some further weakening may even be needed going into late fall and winter, as the El Nino is expected to die down further going into that time frame.

As for winter-- The analog year of 2006-2007 that I posted on the earlier referenced post is looking better and better to me, as long range forecasts encourage a stormy pattern over the central and east US, with ridging in the Northwest. Some of you may know a pattern called the LRC, or Lezak Recurring Cycle, and this may be a part of that cycle that is setting up this winter.

Here are the 2006-2007 winter anomalies.


The winter of 2006-2007 was a wet one for the Ohio Valley and Midwest into the Plains. The probability of this exact scenario is unlikely, and there are always additional margins for error with using only one analog year. However, with each day of the atmosphere and SST's differing on the Nino, the prospect for a 'fake' El Nino grows further.

Andrew

El NiƱo Post Coming Out At 4:30 PM CT

New and very interesting developments concerning the El Nino have come to my attention. A post with the details on the new information will be out at 4:30 PM CT this afternoon.

Andrew

Monday, September 10, 2012

Long Range Arctic Oscillation Pointing Negative

Courtesy Kyle MacRitchie
A long range forecast for the Arctic Oscillation, an index commonly used to distinguish potentials of cold weather, is dipping into negative territory. As shown above, ensemble forecasts of the AO are bringing the index well into negative territory beginning in October and into the winter months.

A continuity of such a negative Arctic Oscillation would enhance cold weather potential over the nation. A negative AO also enhances the chances for a negative NAO, seeing as how close the two indices are. This does not necessarily mean that they will both go negative, but, because they are so close in how they function, they can move together.

This is still very long out and subject to major change, so take this and use it at your own risk.

Andrew

Winter's On The Way: First Cold Outbreak On The Horizon

Hour 192 of the 12z ECMWF
The first real cold outbreak of the season appears to be on the horizon, signaling winter is peeking around the corner.

The ECMWF is forecasting a strong disturbance to drop down into the northern Plains in mid-September, as depicted above. The 540 line on the upper right image is dipping down into the Northern Plains. The 540 line is commonly referred to as the rain/snow line, with snow being north of the 540 line. That said, if precipitation were ongoing in the northern Plains and this verified, some very early snow may fall in North Dakota/Minnesota.

After the system dips into the US, it will become closed off, and its cold pool will rotate around the western side of the storm. As it closes off, it will rapidly strengthen over south central Canada. This will likely produce some windy weather in the southern Canada and northern Plains regions, and cool air should continue to flow around the regions mentioned.

This is just one of a few signs being seen that show winter is inching closer to our region.

Andrew

Sunday, September 9, 2012

Why We Aren't Truly In An El Nino, And What It Means For This Winter

Sea surface temperature anomalies have consistently been displaying an El Nino is in place. Anomalies of as high as 1 degree above normal are being spotted in the waters of the equatorial Pacific. However, the atmosphere is not acknowledging the presence of an El Nino, and this could be a problem going into winter.

As the regional SST anomalies from the Climate Prediction Center are showing, above normal water temperatures are present across the central ENSO regions (Region 3 and 3.4). These anomalies are inching up towards the 1 degree mark, which would make this a borderline moderate El Nino.

Animations of the water anomalies show a progression west of these warmer waters, and this is reflected by a sharp drop-off in the Nino 1+2 region, known as the most eastern region in the ENSO monitoring area.

Here, we see observed 850mb wind anomalies across the ENSO monitoring area. Looking at this chart, we do not see any significant anomalies suggesting any phenomena is ongoing in the area. Now, if we look at the typical El Nino 850mb anomalies, we see an enhanced area of winds in the central portion of the monitoring area in the September timeframe (image below).

This lack of 850mb winds is a curious feature, and would seem to confirm the proposition that the atmosphere is not on the same page as the sea surface temperatures. However, 850mb winds are only one card in the deck of factors we use to monitor the ENSO phases, so let's continue digging for information.

Something else we can use to watch for an El Nino or La Nina is the Southern Oscillation Index, or SOI. When the SOI is above 8, the atmosphere is indicating the presence of a La Nina. On the other hand, a -8 on the SOI shows that an El Nino is shown. Looking at this screenshot of recent SOI observations from the Australian government, we can see monthly average SOI values. In June, the average was -10.2, indicative of an El Nino. However, in July, the SOI was basically in neutral, only at 0.1- an oddity for El Nino-like SST waters. Then, in August, only -6.2 was registered on the SOI, further confusing forecasters on what the atmosphere is doing at the moment.

Only adding to the confusion is the lack of enhanced negative OLR values. Outgoing Longwave Radiation, or OLR, measures convection in the equatorial Pacific waters. During an El Nino, the enhanced convection brings about a negative OLR, and a positive OLR indicates a La Nina.


However, looking at observations from the NCDC and CPC (respectively) in the 2 images above, there is no definitive anomaly across where the El Nino would be showing up. More-so, a positive OLR is showing up over the 140W-160W region, where the El Nino has the most influence at the moment. This further confirms the potential that the atmosphere is not fully prepared to handle an El Nino.

In times like these, we turn to analogs to see what would happen in similar situations of a 'fake' El Nino, where it technically is an El Nino, but the atmosphere is not confirming the suspicion. The best analog going around at the moment is the winter of 2006-2007. Let's take a look.


Precipitation anomalies for 2006-2007 were much more La Nina-like than that of an El Nino, with both the Northwest and Southwest drier than normal. Given, the Northwest is typically wetter than normal in a La Nina, but remember, this winter was a 'fake' El Nino- therefore, it still will show some signs of an El Nino. The Plains, Midwest and Appalachians were all wetter than normal, another telltale sign of a La Nina, while the Eastern US was dry as a bone. Even though I am talking a lot about La Ninas, it is only for comparison. I am not indicating a La Nina is going to be present this winter.
As for temperatures, the western US was slightly cooler than normal overall, but much of the region was normal. The northern Plains and East Coast were warmer than normal, showing that an El Nino is influencing the weather patterns.

Looking at that year, one can definitely see telltale signs of an El Nino, such as a warmer northern Plains and dry Northwest, but some odd La Nina patterns are also observed, like a warm East Coast and wet Central US.

It will have to come down to the atmosphere getting its act together and saying that an El Nino is present, because without that, forecasters like myself may as well be shooting blind.

Andrew