Tuesday, August 5, 2014

Weak El Nino Preparing to Surface; Atmosphere Not Responding

The warm water anomalies in the central Pacific look to be pushing towards the surface, possibly inducing the expected weak El Nino for this fall and winter.

CPC
Refresh the page if animation stops looping
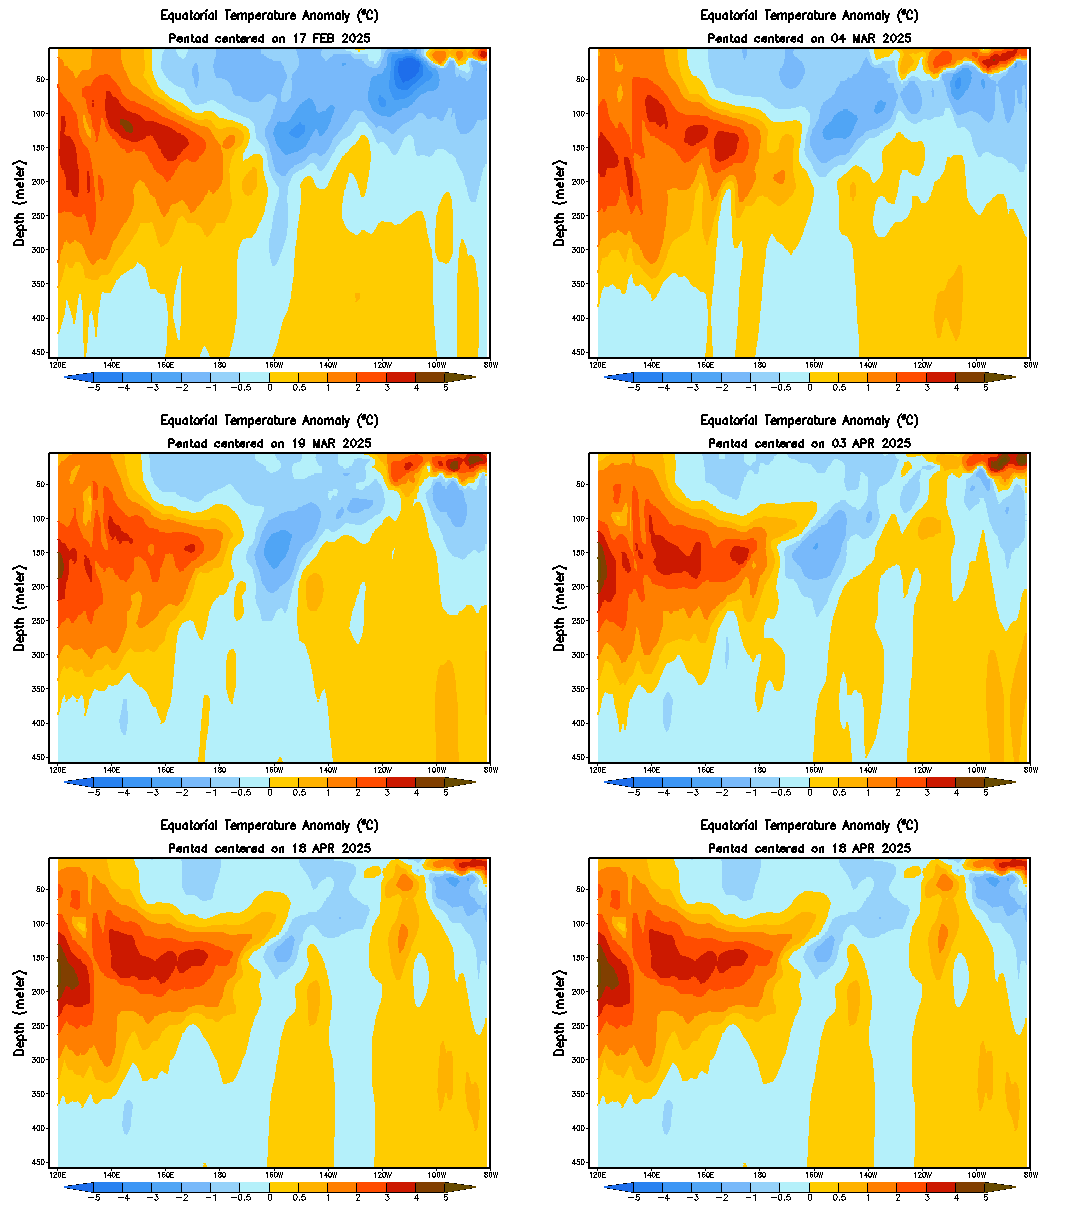
The animation above shows water temperature anomalies along the Equator, on a depth-longitude graph. We can see the extremely above-normal waters pushing into the surface earlier this summer, a byproduct of the Kelvin Wave that traversed the Pacific during this past spring. After the warm waters dissipated, we saw a swath of below-normal water temperatures take over. This put us back to the same neutral-ENSO / Cool-Neutral ENSO situation we've been in for the past couple of years. Fast-forward to the present, and we see a new situation developing.

Warm water anomalies have been steadily building underwater around the Central Pacific region, between about 100 to 200 meters below the surface. These waters have been organizing themselves in recent days and weeks, and the eastern-most portion of these positive anomalies has begun shifting towards the surface, and towards the east. It is currently expected that these warm waters will push east and eat away at the below-normal water temperatures. If the warmth can sustain itself and hit the surface, this should be our weak El Nino, possibly more towards a moderate El Nino at best.

NOAA
In order to actually see an El Nino develop, however, we'll need to see the atmosphere respond, which isn't happening just yet. Shown above are two panels; one shows the mean surface wind currents across the Equatorial Pacific, while the bottom one displays anomalous wind currents. In order for the atmosphere to indicate an El Nino is present, we would have to see winds going from west to east, as part of the reversed Walker Circulation, which is displayed below in the form of the regular circulation.

BOM
Switch wind direction  and warm/cool anomalies' places to observe reversed (El Nino) Walker Circulation.
In the Walker Circulation, surface winds go east-to-west, where the air rises due to convection near Australia. Upper-level winds then push west-to-east, before sinking near the South America coastline, completing the circulation. This is commonly seen in a La Nina event. The El Nino reverses the Walker Circulation, where surface winds push west-to-east, allowing convection to develop along the coast of South America. Upper level winds are carried westward, before sinking near Australia.

If we look back at the surface wind current image above, we can see the winds along the Equator pushing predominantly to the west, indicating that the atmosphere is not favorable for an El Nino. We have yet to see if this will change in coming months, and if it may allow for an El Nino to actually establish itself.

Andrew
Monday, August 4, 2014

Notice

After some thinking and analyzation of where the blog is at now, I've decided to go ahead and enlist advertising for The Weather Centre. These adverts will be placed on the sidebar of the blog only, so as not to disrupt the environment of the blog.

I decided to enlist advertising to benefit the blog, and all of you. If I am lucky enough to collect any substantial revenue from these ads, I hope to invest in products to improve the blog's experience. Such investments may include paid model subscriptions, enhanced radar software, and other ventures.

These ads are not meant to be a big source of revenue for me- that's not my intention, at all. These ads are only meant to better the blog as a whole.

Unfortunately, I cannot control the majority of ads that appear on the blog, so I apologize in advance if any are not related to the website, may be controversial, or are just "odd", for lack of a better term.

If you have any concerns or suggestions on these ads, please don't hesitate to voice them, since, at least from my point of view, this may be a rather controversial move.

Andrew

Sunday, August 3, 2014

Arctic Sea Ice, Temperatures Indicative of Winter Ahead

Latest observations of Arctic sea ice anomalies, as well as temperature anomalies, may hint at what's to come this winter.

COI
The above graph shows past records of Arctic sea ice over time, categorized by color, with the key on the bottom left. This year's sea ice observations are shown in the thick black line, while 2013's sea ice observations can be viewed by the orange-colored line. Glancing around this chart, it's quite evident that sea ice anomalies in comparison to recent history are above normal this year. Showing itself more recently, these above-normal sea ice anomalies appear to be eclipsing the observations of 2006, which appears to be the highest areal sea ice coverage minimum in the last ten or so years. This recent slowdown of declining ice coverage indicates the presence of cold air over the Arctic Circle, something that stays in that area year-round. What's more important this time, however, is that the cold air is allowing less ice to melt, which in response provides more cold air, and so on and so forth.

COI
The next chart we will analyze is a graph of observed temperatures in the Arctic Circle. The red line on this graph shows observed temperatures, in units of Kelvin. The green line indicates the average temperature for a given date, and the solid blue line depicts the freezing temperature. Arctic temperatures have remained almost completely below average since this spring, a rather remarkable feat. Temperatures currently are above freezing, as is to be expected for the summer season, but observed temperatures remains below the average temperatures. As we discussed earlier, the presence of cold air and slowing of sea ice melt are likely playing into these below normal temperatures in the Arctic.

To break it all down, these developments tell me the chances of a cold winter ahead are being raised. If we were to see low sea ice levels and warm Arctic temperatures, I'd probably root for a warm winter ahead. However, seeing substantial sea ice presence in the northern Hemisphere, as well as consistently below-normal Arctic temperatures, I believe that these factors could play into the risk of another cold winter ahead.

Andrew

Friday, August 1, 2014

Mid-August Unseasonable Cold Blast Appearing Likely

Yet another blast of unseasonably cold air can be expected, this time around the middle of August.

Tropical Tidbits
The first graphic we will examine shows the GFS model's forecast of 500mb height anomalies over the western Pacific. Blues indicates stormy and cold weather, while reds show warm and quiet weather. This forecast graphic, valid on August 9th, shows a typhoon moving north into the southern portion of Japan. We can identify this typhoon feature by the tight collection of isobar contours, as well as the concentrated nature of the below-normal height anomalies. This typhoon is expected to be weakening as it makes its move north into Japan.

Tropical Tidbits
This next graphic shows the same GFS forecast of 500mb height anomalies, now valid on the evening of August 9th, whereas the first graphic showed the forecast for the morning of August 9th. In this picture, we can still see our typhoon feature, now pulling itself northeast through the main part of Japan. The isobars are no longer as concentrated, and this can be contributed to both weakening of the typhoon, as well as the lower resolution forecasts this GFS model makes after forecast hour 192 (you'll notice that this graphic shows the forecast for hour 204).

Why is all of this significant? The general premise that I've discussed numerous times on this blog, particularly in the wintertime, is that the weather in East Asia can affect our weather here. To clarify, for example, high pressure over Japan would mean high pressure over the US 6-10 days later. Similarly, low pressure over Japan could indicate stormy weather in the US 6-10 days later, and so forth. We can use this rule to our advantage here. We see a strong typhoon hitting southern Japan on August 9th, and tracking through the middle of the country before shooting east into the open Pacific. By using this correlation technique, we can identify that cold weather and a general stormy pattern may be anticipated 6-10 days after this August 9th impact. Do the math, and we can expect an unseasonable cold weather event around the August 15-19 timeframe.

Details still need to be refined, as this is a long range forecast, but the chances are good that cold weather may be expected in the middle of August.

Andrew

Wednesday, July 30, 2014

Fall 2014 Seasonal Forecast

This is the outlook for Fall 2014.

We will begin by analyzing the temperature outlook from a trusted long-range ensemble guidance system.

CPC
For the August-September-October period, the ensemble system shows an outlook of warmer than normal temperatures across the Western US and portions of the Northeast, with darker shadings indicating higher confidence in that forecast anomaly. The warmest temperatures appear to be centered over Montana and Idaho in this outlook, as well as portions of New York and towards Maine. The big story here, however, is the anomalous cold shown in this outlook. We see below normal temperature anomalies extending from the Canada/US border, all the way down to the US/Mexico border. The core of the cold looks to be across the Plains and Midwest, with higher confidence in cold weather displayed by the dark blues. These dark blues look to be most prevalent in the Midwest, Plains, Great Lakes, Ohio Valley and Mid-Atlantic.

CPC
If we fast-forward to the October-November-December temperature forecast, we find a similar outlook as the one we just analyzed for the August-September-October period. In this forecast graphic, we see cold weather forecasted across most of the nation. The cold extends from the Pacific Coast to the Carolinas, with the deepest cold weather displayed over the North and Central Plains, as well as the Southwest US. Most of the coastal Eastern Seaboard looks to be in slightly above normal temperatures, though confidence in this is rather low.

After a cold winter, spring and summer, a cold outlook for fall is something that makes sense. We are still seeing that persistent pool of warm waters in the northeast Pacific, which has allowed these seasons to be so chilly. As a result, we should be wary of a chilly fall this year, something that could continue into the winter.

Let's now examine the precipitation outlook.

CPC
The precipitation outlook for August-September-October from this long range ensemble system has a variety of conditions across the country. We see a general dry trend over the Southwest, unfortunately worsening the already-catastrophic drought in California and other states. The Pacific Northwest is showing a variable signal. The North Plains are exhibiting above-normal precipitation anomalies in rather high confidence for this timeframe, and this trend continues into the Midwest and Great Lakes. A stark dry trend is observed in the Southern Plains with enhanced confidence, and a similar story can be found in the upper Midwest. In the East US, we see mainly variable conditions that cannot let us determine a particular forecast for this area. Beyond this forecast period, the precipitation outlook exhibits too low of confidence to determine a thorough forecast.

Because we don't know what the El Nino situation will do for this fall and winter, it's hard to see how reliable this precipitation outlook is. The drought conditions in the Southwest should allow for a general dry trend there by process of a feedback loop, unless we see a sustained El Nino arise. I do believe we see conditions in the Midwest and Great Lakes a bit drier than they are projected to be, with conditions along the East Coast averaging around normal or slightly above normal.

Andrew