Showing posts with label East Asia. Show all posts

Wednesday, March 18, 2015

Warmer Weather Returns After Early April Cold Blast

It looks as if warm weather will make a comeback after a stark cold shot hits to close March and open April.

Tropical Tidbits
In the image above, we see 500mb geopotential heights over the West Pacific, where reds indicate above normal values typically associated with high pressure and calm weather. Blues indicate toughing, symptomatic of colder and stormier weather on the surface. In this chart, valid on March 27th, we can see the strong ridge over Japan and areas just off to the north, with a slight trough to the south.

Using this, we can predict what the first week or so of April will be like. The Typhoon Rule tells us we can expect weather phenomena in Japan to 'happen again' here in the US about 6-10 days later. If the image above is valid on the 27th, we should expect some warmer weather around the first couple days of April. However, it's very possible this warmth is actually delayed, due to the aforementioned cold weather hitting the country at the end of March and start of April.

To summarize:

- After cold weather hitting in late March into the first couple days of April, warmer weather should make a comeback.

Andrew 

Sunday, March 15, 2015

Wintry Blast Expected to Close March, Open April

After a warmer ending to March, it is expected that a cold air mass will deliver one of the last punches of wintry weather to the country.

Tropical Tidbits
The image above shows 500mb geopotential height anomalies across the West Pacific. This forecast comes off the GFS model, valid for Wednesday, March 18th. We see a strong ridge located over Japan in this image, likely a result of the deep toughing further east in the North Pacific, as well as some more activity further west. When we apply the Typhoon Rule, stating that weather events occurring over Japan will 'come back' and 're-appear' in the US 6-10 days later, we could expect a generally warmer pattern persisting through about March 26th-ish, probably a bit longer.

Tropical Tidbits
The picture becomes much more ominous by March 23rd. By that time, the GFS model expects a rather large upper level low to drop into Japan, as shown by the deep negative anomalies over the island nation. In a nutshell, this means very cold weather is expected about 6-10 days later, likely in the very final days of March and the first week or so of April. If this happened in the middle of winter, we would likely be looking at record-breaking cold. However, due to the significant loss of snow-cover as of late, as well as climatological numbers telling us how quickly our average high and low temperatures are rising, this will likely be more of a strong cold blast, as opposed to a deep freeze.

To summarize:

- Predominantly warm weather is expected to persist through the end of March.
- The last few days of March and first week of April could see a shot of rather strong cold weather.

Andrew

Wednesday, March 11, 2015

Colder, Stormier Weather Returns for Late March

Model guidance is indicating we're likely to see another stormy and cool period to end March.

Tropical Tidbits
The image above shows 500mb geopotential height anomalies over the West Pacific and eastern Asia. In this chart, oranges depict ridging aloft, a signal for warmer and generally quiet weather. Similarly blues depict toughing/storminess, and thus brings about cooler weather. In the graphic above, we see a persistent trough sitting over Japan and the Koreas, as signified by the plethora of blues. This is actually a mess of storm systems and cool weather combined.

When we apply the Typhoon Rule, which states weather phenomena occurring in Japan is reciprocated here in the US about 6-10 days later, we should expect a generally stormy and cool pattern around March 18-24 or so. This includes a stormy end to spring break for those who vacation next week, and a similarly cool/wet pattern for those who begin their vacations the week after next.

Tropical Tidbits
Models are already honing in on that colder weather. The above graphic again shows 500mb geopotential height anomalies, but this time over the United States and valid on March 18th. Here, we see prevalent ridging over the western half of the country, leading to pleasant conditions in the Rockies and Plains. However, a deep upper level low is forecast to traverse the Northeast and southern Canada, as the deep blues show. This means cold weather, possibly bringing about snowfall in the process for some.

To summarize:

- A generally stormy and cool pattern is expected for the second-to-last week or so of March, primarily around March 18-24.

Andrew

Thursday, February 19, 2015

Long Range Outlook (Made February 19, 2015)

This is the updated long range outlook, made on February 19th, and valid for late February into the first half of March.

Tropical Tidbits
Click to enlarge
We're currently seeing a portion of the semi-permanent Arctic low pressure vortex intruding into the United States, with anomalously low 500mb geopotential height values appearing in the colored shadings and analysis in the graphic above. This anomaly has been forced by a strong ridge pushing into Alaska from the northeast Pacific and west coast of North America. Over the next few days, cold air intrusions should continue as this ridge flexes its muscles and persuades additional Arctic air masses to collapse into the lower latitudes.

ESRL
I want to now go over the teleconnections over the next two weeks, which can help us diagnose the pattern heading into the 14-31 day period.

Top left: PNA Forecast
Top right: NAO Forecast
Bottom left: WPO Forecast
Bottom right: EPO Forecast

A quick refresher on the PNA, NAO, WPO and EPO...
The Pacific North American index involves what the atmosphere does in the northeast Pacific and the western coast of North America. When we see a stormy pattern in place over these regions, we call such a pattern a negative PNA, due to the below normal height anomalies in this region. In a similar sense, when high pressure dominates that same region, we call that a positive PNA. A negative PNA will bend the jet stream to give the storms to the Plains and the Deep South regions, frequently initiating high pressure system formations over the Central US. A Positive PNA will bring about an opposite response to high pressure (HP) over the West, and will have the stormy pattern evolve over the East US.

The North Atlantic Oscillation involves the presence of a high pressure system over Greenland (negative NAO) or the presence of a low pressure system over Greenland (positive NAO). In the negative NAO, the jet stream will buckle into the Northeast to allow storms and cold to thrive in that region. The positive NAO denies this region any of these benefits.

The WPO (West Pacific Oscillation) and EPO (East Pacific Oscillation) are very closely related. In the negative phase of the WPO, a strong ridge exists over the Bering Sea, which can allow for sustained cold weather in the Central and Eastern United States. The negative phase of the EPO gives similar results, though the ridge is positioned in the Gulf of Alaska instead. The positive phase of both the EPO and WPO see warm weather prevail in much of the US, as stormy weather replaces the ridges in each respective region.

The positive PNA and negative EPO have worked in tandem to indicate this strong ridge blossoming into the Gulf of Alaska and general northeast Pacific. In the upcoming couple of weeks, model guidance is indicating we see the ridge shift further offshore to the west, as the PNA dip from positive to negative shows. Over time, ensemble guidance is telling us that this ridge could keep shifting west, resulting in the EPO actually moving positive for the first time in a while. The positive EPO signal, however, is weak, and will have to be watched for a 'false positive', both literally and metaphorically. If this forecast does verify, we can expect a warm-up in the early days of March.

Tropical Tidbits
Ensembles indicate we will see a ridge of high pressure pushing into Japan on the morning of February 21, as the graphic above shows. Using the Typhoon Rule, which states weather phenomena occurring in Japan is reciprocated in the United States 6-10 days later, we can anticipate a warm-up for millions that have undergone a brutal February in the final days of the month, likely into early March. From there, confidence decreases, but a return to an average or cooler than normal pattern may be expected.

You'll notice I haven't used tropical forcing in this post; that's because the ridge in the West is just so overpowering that the Madden Julian Oscillation can't do much of anything.

To summarize:

- A cold pattern is expected to round out February.
- A warm-up is expected for the last days of the month into early March.
- The first half of March should be characterized by a generally average to slightly below-average temperature pattern. There are hints of some stormy weather in early March.

Andrew

Saturday, February 7, 2015

February 22-27 Potential Winter Storm

Model guidance has been hinting at a rather strong winter storm impacting the United States around a February 22-27 period.

Tropical Tidbits
Click images to enlarge
The above image shows the GFS forecast of 500mb geopotential height values (colored shadings) and mean sea level pressure contours over the West Pacific, valid on February 16th. In this image, which is from the GFS model run on the morning of February 4th, we see a very strong low pressure system crossing Japan and moving away from the country as it does so, with a minimum central pressure here of 987 millibars. This is a very strong system, but one might argue that can be expected from long range guidance, which can/does tend to over-amplify storms in long-range forecasts.

Since that forecast was made, at least 5 other GFS runs came in with very similar solutions, meaning this could be a valid storm potential. You'll notice that the timeframe isn't exactly the same on each graphic, but the storm impacting Japan between February 16-17 is generally agreed upon.

Tropical Tidbits

Tropical Tidbits

Tropical Tidbits

Tropical Tidbits

Tropical Tidbits
While this model remains inconsistent as far as showing this storm run-after-run, the general concept of a storm in this timeframe is still present (for now).

When we apply the Typhoon Rule, which states weather phenomena occurring in Japan is reciprocated in the United States 6-10 days later, we can extrapolate the storm in this February 16-17 timeframe to get a rough estimate of a February 22-27 correlation here in the US, padding in a couple days for uncertainty. But we may also be able to figure out where it tracks.

ESRL
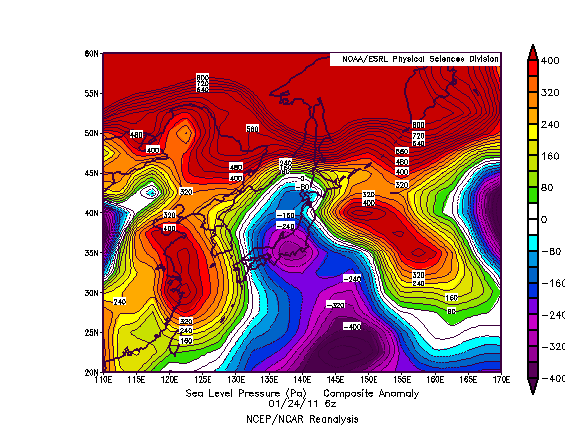
The above image shows sea level pressure anomalies on the morning of January 24th, 2011. On this day, we saw a storm system cross Japan and rapidly strengthen as it began to exit the eastern coast of this country. Just for kicks, let's apply the Typhoon Rule here. If we do so, we likely saw a storm system impact the country between January 30th and February 3rd, 2011.
Some of you might remember that as the Groundhog Day Blizzard of 2011, which dropped close to 24" of snow in Chicago, IL, as well as incredible ice accumulations in the cold sector of this storm. When we compare the projected track of our mid-February storm in the GFS images above, we see that some (not all) forecasts have the upcoming low taking a similar track as the eventual-Groundhog Blizzard did. That's not to say I'm expecting another massive blizzard. I'm just trying to show where this storm could end up tracking, and that could be through the Midwest yet again.

Tropical Tidbits
There's also the chance we see this storm go through the East US and impact that area primarily. The reasoning behind this is the expected ridge-out-west and trough-out-east pattern which will likely deliver more than one round of accumulating snow to the East (more on this can be found in yesterday's post). The image above shows the GFS ensemble outlook at the very end of its run, depicting 500-mb geopotential height anomalies for February 22, 2015. We see a gradual departure of the trough in the East into Greenland, though the ridge in the West is still persisting. Personally, I'd bet more on the trough staying put purely out of persistence forecasting, but that's why you take model guidance with your own opinion. If this forecast did work out, however, the storm could impact the Central US and East US, whereas the trough staying put would result in an impact likely for the East.

CPC
If we factor in tropical forcing, we get yet another different picture. When the timeframe for this storm rolls around, enhanced tropical convection is forecasted (not shown here) to be placed in an area around and just east of the 90ª East longitude line, which places us in Phases 4 or 5 of the Madden-Julian Oscillation (MJO). The above graphic shows precipitation anomalies on the left two columns; we'll ignore the colorful columns on the right for now. When we look at precipitation anomalies during Phase 4 and 5 in a January-February-March period, we tend to see the Central US into the Northeast getting in on storm activity. This could mean the storm in late February, if it happens to begin with, will hit both the Central US and East US, but anything beyond that is purely guessing.

To summarize:

- There are indications a strong storm could hit Japan in the middle of February.
- This could result in a strong storm in the United States between February 22 and February 27.
- It is not known who will/could be affected by this system yet.
- As the post thoroughly showed, significant uncertainty surrounds this event.

Andrew

Tuesday, February 3, 2015

February 16-20 Potential Arctic Outbreak

There appears to be the risk of an outbreak of cold air between a February 16-20 period.

Tropical Tidbits
The image above shows 500mb geopotential height anomalies over the West Pacific, forecasted by the GFS model and valid on the morning of February 10th. In this image, we see a very strong upper level low displaced just north of Japan, with contours telling me this is a sub-500dm upper level low- a very strong storm. When we use the Typhoon Rule, which states weather phenomena occurring in Japan is reciprocated in the United States 6-10 days later, a strong upper level low could approach the United States from the north in a February 16-20 period. It's too early to tell definitively, but this could correlate to a lobe of the tropospheric polar vortex plummeting south towards the mid-latitudes. Again, it's too early to tell right now.

ESRL
Long range ensemble forecasts for the middle of this timeframe are already beginning to see strong upper latitude blocking leading to a new wave of cold weather for the Central and East US, as those blue colors shown over North America. We will need to watch upcoming forecasts to see how they change.

ESRL
For comparison, here's the chart of 500mb geopotential height anomalies over Japan on December 27th, 2013. We saw a very strong upper level low drop south into southern Japan, which then correlated to the infamous cold blast which originally made the phrase 'polar vortex' go viral. Forecasts above don't see the impending upper level low dropping as far south, which is why I'm thinking this upper level low will approach the region, and not necessarily induce a period of incredibly frigid temperatures, like we saw last winter.

To summarize:

- A strong upper level low looks to drop south to scrape northern Japan in the next week.
- As a result, we could see a period of below-normal, possibly well below-normal temperatures between February 16th and February 20th.

Andrew

Monday, February 2, 2015

February 10-15 Potential Winter Storm

I'm watching for the potential for wintry weather in the February 10-15 period.

Tropical Tidbits
The image above shows 500mb geopotential height values for the morning of February 5th, with mean sea level pressure (MSLP) contours superimposed. In this graphic, we see two areas of low pressure over the Western Pacific. The more dominant system is located south and east of Japan, with another piece of energy just west of this island nation. In the forecast hours after this graphic, it appears the energy west of Japan transfers to the storm east of Japan. From there, the dominant low moves generally northeast, away from Japan. When we use the Typhoon Rule, which states weather phenomena occurring over Japan is reciprocated in the US 6-10 days later, a storm in the US might be expected in a February 10-15th period, adding a day for some uncertainty I have on timing. Additionally, the transfer of energy over Japan tells me we could be looking at a transfer scenario from the Midwest/Great Lakes/Ohio Valley into the Northeast.

ESRL
We can take a look at teleconnections to get a glimpse at what this storm might do. For this post, we'll pay attention to the top-right North Atlantic Oscillation (NAO) outlook. Notice how the index rises from negative to neutral territory right in the timeframe of this potential winter storm. The NAO switching phases is known to be a red flag for snowstorms in the Northeast, as the risk of snow events in that area tend to rise when this switching of phases occurs. This could support the idea of a transfer storm to the Northeast, like the GFS showed (in a likely overdone projection) in its 12z forecast:

Tropical Tidbits

To summarize:

- Model guidance is indicating a winter storm may impact the country in a February 10-15 period.
- As of now, a transfer low from the North-Central US to the East Coast may be a likely solution.
- As usual, high uncertainty still exists.

Andrew

Sunday, January 25, 2015

January 28 - February 1 Potential Winter Storm

We're watching for a potential winter storm in a January 28th through February 1st timeframe.

Tropical Tidbits
Click Images to enlarge
The above graphic shows mean sea level pressure (MSLP) contours superimposed on 500mb geopotential height values (colored shadings), valid from last Thursday morning. Last Thursday, we saw a positively-tilted trough forcing a rather strong low pressure system to form just east of Japan, dipping below the 1000 millibar mark on this image. When we apply the Typhoon Rule, which states weather phenomenon occurring in Japan is reciprocated in the US 6-10 days later, we come out with a potential winter storm in the January 28 - February 1 timeframe.

Instant Weather Maps
Initially, the ECMWF takes this system down through the Midwest and Ohio Valley, as the above image shows on the evening of January 29th. We see a minimum sea level pressure value of about 1008 millibars, if not a bit below that. This won't be a significant storm, per current forecasts, but could drop some wintry precipitation across the aforementioned regions.

Instant Weather Maps
By the evening of January 30th, the ECMWF model sees this storm transferring offshore the Mid-Atlantic, strengthening at an appreciable pace to a minimum sea level pressure value of ~997 millibars. This would likely produce accumulating snowfall for parts of the Northeast, as the GFS model is also alluding to, but again, nothing incredibly significant.

To summarize:

- A winter storm may affect the US between January 28th and February 1st.
- This storm may affect the Midwest, Ohio Valley, and Northeast the most, if at all, given the relatively-weak strength of this storm.

Andrew

Thursday, January 15, 2015

Significant Arctic Outbreak Threat Rising for Late January

Model guidance is combining with the long range tools commonly used on this blog (namely the Typhoon Rule) to portray the country's best shot at true wintry weather to end the month of January.

We'll start off with the Typhoon Rule.

Tropical Tidbits
Click on any image to enlarge
The above image shows the GFS forecasted 500mb geopotential height anomaly forecast in the West Pacific region, valid for the morning of January 17th. In this image, we see warm colors, indicative of positive height anomalies / typically warm and quiet weather, but we see a much different picture over Japan. In Japan, a strong upper level low is impacting the country, sliding to the east as it does so. Notice how the center of this upper level low appears to go directly over far northern Japan.

The Typhoon Rule can be used to predict weather phenomenon in the United States. The rule of thumb indicates that weather phenomena impacting Japan is reciprocated in the US about 6-10 days later. So, if we see a strong (and very cold) upper level low crossing northern Japan on January 17th, we can extrapolate this upper level low to "re-appear" in the US on a January 23-27th timeframe.

Does this solution have any support from ensemble guidance? Let's find out.

Weatheronline
The image above shows 500mb geopotential height values (not anomalies) from the prestigious ECMWF ensembles set, valid on January 25th. These types of charts are generally used to identify the presence of large-scale ridges or troughs. In this image, we see a very pronounced depression in the contour lines, bringing the 520gpdm line all the way down just south of the Canada/USA border. This depression of contours shows the presence of a strong upper level low, which is actually centered all the way up in northern Canada.

The strong upper level low is being forced southward due to that strong ridge of high pressure developing along the West Coast. Other guidance eventually does much bigger things with that ridge even further down the road, but we'll get to that a little later on in this post. For now, the takeaway from this forecast is very cold conditions might be on deck for the late January period. I have discussed this end-of-the-month timeframe for some cold weather in earlier posts, but its significance is quickly becoming more realized.

ESRL
Next up, we'll analyze the ensembles off of the ESRL agency, a physics-based modeling branch of the NOAA body. In this image, showing 500mb geopotential anomalies for January 26th, we see a similar layout as the ECMWF ensembles showed. Strong negative height anomalies are developing in the Central and East US as the ridge along the West Coast continues to build and push northward. In these sorts of situations, the ridge may force itself so far north that it becomes a 'blocking' mechanism.

What is 'blocking'? My favorite example is to imagine a highway, with traffic moving along at an even pace. That's a good representation of the atmosphere during 'normal' flow. Now, imagine something happens on the highway that forces the cars to stop - a back-up, perhaps. The cause of this 'back-up' is analogous to the blocking ridge of high pressure; the ridge forces itself towards the North Pole and blocks the atmospheric flow from moving things along. This has been known to produce flooding, long-lasting cold, or intense warmth, depending on the season and who is affected.

ESRL
The upcoming pattern is very similar to that shown by the negative phase of the West Pacific Oscillation (WPO). In the image above, we see typical temperature (bottom panel) and 500mb geopotential height anomaly (top panel) values for a positive WPO phase. Notice how stormy conditions persist just west of the Bering Sea during a +WPO phase, leading to warmth across most of the Central and East US.

To see the typical conditions during a negative WPO phase, just flip the color scale. We then see intense ridging just to the west of the Bering Sea, leading to sustained cold flooding the Central and East US. The eventual alignment of this ridge into the waters near the Bering Sea, as the GFS ensembles are indicating, would lead to this -WPO pattern.

The final (and what I consider the most surprising) part we have to go over is the analog forecast.

CPC
This image shows projected 500mb geopotential height anomalies, valid for about 11 days from today, based on the top ten analogs (dates with the atmospheric pattern similar to the one forecasted to occur 11 days from today) produced at the Climate Prediction Center. In this image, we can see that strong ridge along the West Coast of North America into Alaska, resulting in below-normal anomalies over the Central and East US, eastern Canada, and into Greenland. Just for kicks, let's see what the top analog of 20090118 (January 18, 2009) shows, since it has been deemed the most similar to the forecast down the road.

ESRL
Above, we see temperature anomalies from January 16, 2009. I went back two days as the cold wave had already pushed east by January 18th; we want to get a diagnosis of the cold wave itself. This graphic is in units of Kelvins, but we can easily convert to Fahrenheit.

The core of the cold extends from southeastern Minnesota into far western West Virginia. A spot of values below -17.5 degrees below normal (Kelvin) shows up along the border of Indiana and Ohio. Let's see how -17.5 degrees below normal in Kelvins translates to Fahrenheit. Doing the math, that area saw temperatures 32 degrees (Fahrenheit) below normal for this cold wave, deemed the most similar to what we could see to end January. That's very impressive; for a scale of how impressive it is, consider that the average temperature in Richmond, Indiana (very close, if not inside that -17.5 Kelvin anomaly) to end January is 37 to 38 degrees F. In this cold snap, temperatures likely dipped down to just above zero, with even colder conditions to the north.

By no means does this mean we'll see something as cold as what happened on January 16, 2009, but it gives you an idea of the type of pattern that's coming down the pipe to end January.

To summarize:

- Model guidance and the Typhoon Rule are in agreement concerning a potentially significant cold blast at the end of January.

Andrew

Wednesday, January 14, 2015

January 21-25 Potentially Significant Winter Storm

It's looking as if a winter storm will impact the United States between January 21st and January 25th. As of now, this storm has potential to be a strong one.

Tropical Tidbits
The above image shows mean sea level pressure (MSLP) and precipitation values for the morning of January 15th over the West Pacific. In this graphic, we see a strong low pressure system moving up the eastern coast of Japan, delivering heavy precipitation to areas offshore of the island nation. A look at 500mb vorticity values (not shown) depicts this storm phasing with another piece of energy to strengthen and mature the energy into a substantial event.

If we recall that the Typhoon Rule states weather phenomenon occurring in East Asia is replicated here in the United States about 6-10 days later, we should expect a storm system, possibly strong, to hit the US in a January 21-25 timeframe. The orientation of this storm striking the east coast of Japan tells me it may come up from the South US and hug the East Coast here in the US.

Interestingly enough, model guidance is approving of this theory.

Tropical Tidbits
The new GFS (the old GFS model was retired with this morning's 12z / 6AM central time runs, and replaced by what was known as the GFS-Parallel model) is showing a storm system developing in the Southeastern US on January 23rd. Here, we see a large swath of heavy rain, likely containing thunderstorms draped across the Gulf Coast into the Mid-Atlantic, as well as a heavy snow swath spread across the Ohio Valley and into the Northeast. This is something like I would expect to see happen with the way our energy acts when it skirts around Japan in the earlier graphic we analyzed.

Tropical Tidbits
By the evening of January 23rd, we find our storm has moved offshore, dragging an impressive liquid precipitation shield behind it, which then drags behind it a very cold airmass to introduce the anticipated cold blast to close out January. A strong snow swath remains present, but the most intense snow appears to strike Long Island in New York, as well as other coastal spots. Lighter, but still impressive snows then impact more inland regions.

To summarize:

- A storm is expected to impact the United States between January 21 and January 25.
- This storm has the potential to be strong, per current guidance.

Andrew

Friday, January 9, 2015

January 17-21 Potential Winter Storm

There is potential for a disturbance in the January 17-21 timeframe.

Tropical Tidbits
The above image shows 500mb vorticity values across the Western Pacific from the (soon to be retired) GFS model, valid the morning of January 11th. Here, we see elevated vorticity values pushing east from the mainland of Asia. Of note is the shortwave evident just west of Japan, as the depression in the 500mb contour lines shows. This is the storm system we are watching.

A look at mean sea level pressure (MSLP) values for this same timeframe indicates the storm would be crossing almost squarely over the middle of Japan. Using the Typhoon Rule for timeframe, extrapolating the date of this graphic out 6-10 days, we come up with a possible storm in the US during a January 17-21 timeframe.

ESRL
The above image shows teleconnection forecasts from the ESRL agency shows the Pacific North American index dropping to near-neutral levels when this storm is projected to strike. Add in the moderately-positive NAO forecast, and chances are this storm will mainly take a west-to-east track, and is unlikely to "cut" north or south in any drastic manner.

To summarize:

- A storm system may impact the US during the January 17-21 timeframe.
- Indications are this storm could affect primarily the mid-section of the country.

Andrew

Sunday, December 28, 2014

January 6-10 Potential Winter Storm

Model guidance is latching onto what could be our first shot at a strong winter storm, in the January 6-10 timeframe.

Tropical Tidbits
The above image shows 500mb geopotential height values in colored shadings, and MSLP values in contoured lines, across the West Pacific on New Years Eve. In this image, we see a strong low pressure crossing Japan, with a minimum central pressure value of 991 millibars, before sliding north and east towards the Aleutian Islands. If we apply the Typhoon Rule, which states that weather phenomena occurring in the West Pacific is reciprocated in the United States six to ten days later, we may extrapolate this to mean a strong storm could impact the US in a January 6-10 timeframe.

Other model guidance supports a weaker system moving over Japan, meaning we will need to monitor the region in coming days. If the storm crosses Japan at a weaker intensity, the storm here in the US would likely be weaker as well.

Purely for 'eye candy', here's the latest GFS projection of a storm in the East US on January 6th. This graphic isn't a forecast you should count on to verify.
COD
To summarize:

- A storm system may impact the US between January 6-10.
- Storm strength is still uncertain, and all aspects exhibit very high uncertainty at this juncture.

Andrew

Thursday, December 11, 2014

Christmas Potentially Significant Winter Storm

I'm now watching the risk of a strong winter storm rise as we move towards Christmas.

Tropical Tidbits
The image above shows 500mb geopotential height values (colored shadings), with mean sea level pressure (MSLP) values superimposed. In this graphic, valid on December 16th, we see a pair of very strong storm systems, one on each side of Japan. The prognosis is that a strong system will push into the Sea of Japan (located west of the country), while a second storm system will develop in the southern part of the country and move northeast-ward, skirting the eastern fringe of Japan as it does so. It is this second storm that we need to keep a close eye on, and is the one we will be discussing here today.

Using the Typhoon Rule, which states that weather phenomena occurring in East Asia is recipricated in the US about 6-10 days later, we can extrapolate this December 16th date out and predict a storm in the United States in a December 22-26th period... right in the Christmas rush.

But we can expand on this quite a bit more. The storm will be shooting north along the eastern coast of Japan. This does have an impact on the expected storm in the US. As you might expect, it raises the chance of this consequential storm also moving northeast-ward rapidly, and from there, we come out with two prevalent/possible storm tracks:

- A Panhandle Hook storm, where the system shoots north from the Southern Plains. These storms are climatologically favored to bring heavy snow to cities in the east-central Plains and Lower Great Lakes. This scenario is a possibility, as that strong storm in the Sea of Japan would likely correlate to a strong North Plains cyclone. This would keep that body of low pressure east of Japan in an area close-by, as the storms would eventually phase (not to mention low pressure areas are attracted to other low pressure areas).

- An East Coast storm. Because this body of low pressure is forecasted to merely skirt the eastern side of Japan, this could be a plausible scenario. We won't know if either of these are correct until we have more model runs to access.

The graphic above only shows the GFS model view... let's head on over to the European model projection.

Tropical Tidbits
Wow! Can you see the change?

This graphic, showing the same parameters as the GFS image, and for the same timeframe, portrays that strong storm in the Sea of Japan, but now the second storm skirting eastern Japan is more inland. It hasn't shifted much, but it has shifted nonetheless.

What does this mean? It means it's time for East Coasters to throw in the towel.

Not really, but a more inland storm does favor an inland track when the storm comes around in the US. The interesting thing is, this more inland track is an idea. Here's why.

Recall that, whether you learned it or just know it through logic, low pressure areas will try to move towards areas with the least resistance, in this case the least high pressure. My theory here is that the storm in the Sea of Japan, the stronger of the two (shown on the GFS as 993mb, 980mb on the ECMWF), is trying to pull the storm skirting east Japan towards itself. Down the road, model guidance shows the second storm absorbing the stronger Sea of Japan storm, rather than vice versa, and that's also a possibility.
My point here is, there is the possibility of a phased storm.

For those who aren't as knowledgeable with weather lingo, a 'phased storm' is a storm system which is made up of previously-two or more pieces of energy. Typically, phased storms end up stronger than either of the first two pieces of energy were. I'm not holding my breath on this Christmas storm phasing, but it probably isn't a bad idea to keep it in the back of your mind.

Regardless of if this storm phases, remember that the storm on the east coast of Japan is projected to be below 1000 millibars, so it's likely to be a nice little storm in itself.

Tropical Tidbits
We've now confirmed that not only are looking at a storm in the Christmas time period, but model guidance has amped up that threat since yesterday. Now, we have to diagnose the weather pattern here at home in that December 22nd - 26th timeframe, to see if we can pull any hints out.

I've posted the image above from the GFS ensembles, showing 500mb geopotential heights on Christmas morning. Warm colors depict ridging/high pressure, usually indicative of warm and quiet weather. Similarly, blues indicate troughing/low pressure, accompanied by colder and stormier weather. We have more than a few things to talk about with the above graphic.

First and foremost, we're looking at the Pacific driving our pattern to round out December. Tropical activity in the Equatorial Pacific will be dying off in the next few days (more knowledgeable weather folks know this as the MJO weakening), which will shift the weather pattern 'responsibilities' to the North Pacific.

We look to have a positive Pacific-North American (PNA) index pattern in place for this event. We can observe this positive PNA as a ridge forming in the West US, which allows the jet stream to buckle in the Central US. Such a pattern is climatologically favorable for a Central US storm track. In addition, a positive East Pacific Oscillation (EPO) signal will begin showing up, as ridging overtakes Canada. This will be in part due to that positive PNA, but the further east you go, the more the EPO influence takes over. A positive EPO doesn't affect the storm track so much as it does temperatures (above normal in the North US). When we factor into account slight ridging along the Eastern Seaboard, we start to see that signal for a storm system in the Central US, favoring development in the Central US.
I'm a bit skeptical, however, Many Northeast weather buffs may know that winter storms are favored in the East when the North Atlantic Oscillation (NAO) changes phases from positive to negative, or vice versa. Guess what the forecast for the NAO is around this storm's timeframe:

ESRL
We've got a dilemma on our hands, with some variables favoring a Central US storm, and others favoring an East US storm. So is the world of forecasting...

To summarize:

- A winter storm appears to be in the cards for December 22-26th, likely impacting Christmas travel plans.
- A second storm system may need to be watched for the Northern Plains.
- The primary threat here may become a storm favorable for heavy snow, either in the Central/East US (ideally the Ohio Valley/Midwest) or along the Eastern Seaboard.
- Rather high confidence in the threat of a storm in this timeframe, but low confidence in who will be most affected.

Andrew

Wednesday, December 10, 2014

December 22-26/Christmas Potential Winter Storm

I'm watching the potential for a winter storm in the December 22-26 timeframe.

Tropical Tidbits
The image above shows the forecasted 500mb vorticity values on the morning of December 16th, valid over the West Pacific. In this graphic, we see a negatively-tilted upper level low pushing east into Japan, as the elevated vorticity values indicate. We can observe the negative tilt by the height contours seeming to "dig" in a southeast-ward direction. When a trough/storm system is at its mature stage, usually its strongest stage in a storm's life, the storm is said to be negatively tilted.

Using the Typhoon Rule, which states weather phenomena occurring over Japan is reciprocated in the United States 6-10 days later, we might expect this storm to impact the United States in a December 22-26 timeframe... possibly right around Christmas.

But there's more to this story.

Tropical Tidbits
Take a look at this image, forecasting 500mb geopotential height values in colored shadings, as well as mean sea level pressure (MSLP) values in the contoured lines. In this image, valid just six hours prior to the time period in the first image we analyzed, we see a strong storm system in the Sea of Japan, correlated to the strong upper level low.

But wait... there's something else there.

Check out that sagging of contour lines just south of Japan, right where the arrow is pointing. It almost looks like another low pressure system! Other model guidance confirms this idea of a second body of low pressure forming south of Japan and skirting the nation to the east before phasing with the very strong storm in the Sea of Japan. The implications here could be huge.

If that really is another low pressure system, then we have a very interesting scenario on our hands for Christmas. We can't tell for sure just yet, but the storm shooting northward to the east of Japan could mean a few possibilities.
Let's first hypothesize that the item outlined above is indeed a storm system. The track to the east of Japan could either mean we would be looking at:

- A Panhandle Hook storm, where the system shoots north from the Southern Plains. These storms are climatologically favored to bring heavy snow to cities in the east-central Plains and Lower Great Lakes. This scenario is a possibility, as that strong storm in the Sea of Japan would likely correlate to a strong North Plains cyclone. This would keep that body of low pressure east of Japan in an area close-by, as the storms would eventually phase (not to mention low pressure areas are attracted to other low pressure areas).

- An East Coast storm. Because this body of low pressure is forecasted to skirt the eastern side of Japan, this could be a plausible scenario. We won't know if either of these are correct until we have more model runs to access.

ESRL
Long range ensemble model guidance for the evening of December 23rd shows a relatively favorable pattern for a storm. We see strong ridging high pressure in the West Coast of North America, but another swath of high pressure also looks to exist in southern Canada. This could boost temperatures, or worse, suppress and kill the storm system altogether. Even though this is quite far out and should not be taken at face value, those in the Midwest looking for a winter storm should feel rather good from what model guidance is projecting:

Tropical Tidbits
This image from the GFS ensembles shows what I'm talking about. In this image, also valid for the evening of December 23rd, we see a few factors at work here. A strong positive PNA is currently agreed upon by these ensembles, which permits a strong ridge to form in the Western US. This ridge then allows a colder pattern to develop in the Central US, as the jet stream drops southward to accommodate the +PNA ridge. Sweetening the pot is evidence of a very slight ridge in the Southeast, something that could allow any potential storms to move more northward. That final piece to the puzzle will be a bit more difficult to come by, as that strong upper level low over Greenland will try to keep the flow over North America very zonal (west-to-east, jet stream not wavy). There's still, of course, plenty of time for this to change.

To summarize:

- A winter storm may be in the cards for December 22-26th, likely impacting Christmas travel plans.
- A second storm system may need to be watched for the Northern Plains.
- The primary threat here may become a storm favorable for heavy snow, either in the Central/East US (ideally the Ohio Valley/Midwest) or along the Eastern Seaboard.
- Relatively low confidence still exists due to the long-range nature of this threat.

Andrew

Wednesday, November 12, 2014

November 25-29 Potentially Significant Winter Storm

We are beginning to nail down how this potentially significant winter storm may evolve across the country in the days surrounding Thanksgiving.
For my humor and your reading pleasure, I've divided this post into multiple sections, each concerning a different timeframe of this storm.

I. The Instigator 

Let's begin with a refresher on how this potential has come about.

OPC
On the morning of November 8th, we saw the remnants of Typhoon Nuri reach peak strength via Ocean Prediction Center observation. As the chart shows here, the massive storm bottomed out at 924 millibars. This means the storm, located at about 170E and 55N, didn't break the record for strongest extratropical cyclone on record, but it certainly came close.
Why do we care about this storm? The Bering Sea Rule states that a strong storm that hits the Bering Sea can produce a consequential storm in the United States about 17-21 days later. This is the same for high pressure in the Bering Sea. You probably get what I'm getting at here with this observed strong storm in the Bering Sea, so let's keep reading...

NWS
The graphic above, produced by the National Weather Service in Alaska, shows the observed mean sea level pressure of the storm at that 924mb reading, while the NWS office measured it at 930mb on the chart on the left, where strongest extratropical cyclones in the North Pacific are depicted. For multiple reasons, including the possibility that past storms may have been stronger than that 924mb reading, this storm was not declared the strongest on record in the North Pacific. Despite this, it's quite clear this storm was a historically-strong one, relative to storms in the last 60 or so years.

NOAA
Purely for comparison purposes, the team at KOPN Weather identified a strong storm in the Bering Sea on April 7th, 2011, bottoming out at 936mb, that was about 10 degrees W of where this very strong storm was observed yesterday in the Bering Sea. If you recall what happened about 2-3 weeks after the date of April 7th, we saw a certain tornado outbreak strike the South US, devastating thousands across the country, and causing millions on millions of dollars of damage. If we look at where the resultant storm ended up in mid-late April, utilizing the Bering Sea Rule, we find the storm situated in the Ohio Valley.

WPC
Now, keeping in mind that this sort of correlation is a tough one to use at best, not to mention all the caveats associated with long range forecasting, we could theoretically juxtapose the remnants of Typhoon Nuri and this storm in the Bering Sea on April 7th to get an idea of where the consequential storm in the US may end up. Recalling that the storm in 2011 in the Bering Sea was at about 180 degrees longitude, and almost the exact same latitude as the one observed in the last day or two, we find the remnants of Nuri placed about 10 degrees west of that 2011 storm. If we take the location of that storm system in late April (pictured above) and move it west, like the remnants of Nuri were west of that 2011 Bering Sea storm, we end up with a map like this:

WPC
Continuing this correlation, just to see what would happen, we notice that the remnants of Typhoon Nuri are moving eastward (a bit northeast in the process) in the Bering Sea right now, slowly at that. If this storm somehow does end up in that potential location outlined above, and if enough cold air is available (this will be discussed later), a significant winter weather event may strike the Central Plains, Midwest, Great Lakes, and Ohio Valley. Similarly, if the correlation works out, a severe weather event may strike the South US. Confidence remains low, but the potential for this correlation to verify is on the rise.

II. The Japan Connection

Now that we know where this potential is coming from, let's start to use it to our advantage, in the form of the Typhoon Rule (click here for explanation on the rule).

Tropical Tidbits
The image above shows the ECMWF model's forecast of 500mb geopotential height anomalies over the West Pacific. Here, cool colors denote stormy and cold weather, while warm colors depict mild and generally quiet weather. If we take a look at this forecast graphic, valid on November 17th, we find a rather strong trough/storm system pushing eastward into Japan. We can see this trough by the depression of height contours, and associated blue shadings. As this trough pushes through Japan, it looks to close off, a phrase used to describe when those contour lines literally close off and make a circle, indicating a closed low. Until then, we see this negatively-tilted trough hitting Japan around the 17th and 18th. Extrapolating that out using the Typhoon Rule, we find the potential for a storm hitting the US around November 23rd to 28th, oddly enough right around that timeframe that we saw with the intense Bering Sea low.

Tropical Tidbits
Moving on to the next graphic, we find the GFS-Parallel model forecast for November 17th, again forecasting 500mb height anomalies. The GFS-Parallel is not the same as the regular GFS; this Parallel model is the new, enhanced version of the current GFS model, which is set to be 'retired' in the next few months, where the new GFS will take its place. Among new corrections are bias fixes and increased accuracy, etc. The difference from the ECMWF model to this GFS-Parallel forecast is the Parallel model closes off this trough a bit quicker than the ECMWF, as that circular contour line over Japan shows. At this point, it's not so much a question of if this storm will strike Asia, so much as it is what strength will it be and when will it close off. Regardless, the ECMWF and GFS-Parallel both support this storm threat.

Tropical Tidbits
To add in a bit of diversity, let's check out the ECMWF ensemble mean 500mb height anomaly forecast for November 18th. In this image, we see the average of all 52 - yes, as in fifty two separate ensemble members - forecasts favoring a non-closed trough over Japan. This is a bit surprising, as the guidance we went over above has this trough closing off over Japan or just after it leaves the "mainland" of the island nation. Despite this disagreement, which will no doubt be worked through as the time between now and November 17th/18th approaches, the ensembles agree with the other two models on this being a substantial storm crossing Japan, with a consequential storm in the US around November 23-28.

III. The Set-Up

We're now in the timeframe where we can get a view of model projected set-ups for the storm environment (with typical low-confidence, of course). Let's go through the projected set-ups.

Tropical Tidbits
The image above may seem confusing, but it's not that difficult to interpret once you get a feel for it. This image shows the GFS ensemble forecasted 500mb height anomalies, averaged out across the ~20 ensemble members, valid on November 26th. Let's first begin with the positive height anomalies in the West US into British Columbia. We see what are interpreted to be slightly above normal height anomalies, but if this forecast verifies, you'll see these anomalies increase to more extreme values as confidence among all ensemble members increases. For now, confidence is low, so the anomalies aren't as pronounced.
Those positive height anomalies in the West are enabling a positive Pacific-North American (+PNA) pattern to set up. In a positive PNA pattern, ridging in the West forces the jet stream south. If resultant ridging forms in the East, the jet stream then bends north, to enable frigidly cold air to strike the Central/East US, also driving the storm track through that area. This pattern across North America is a classic +PNA pattern, and should be treated as though the Great Lakes/Plains may see the brunt of this storm... initially.
My concern rests with that big upper level low stationed just west of Greenland. If that low becomes too strong and pushes too far south (which is a plausible result), the storm track may be suppressed, and the big winners could end up being the Ohio Valley and interior Northeast. This is something to watch closely in coming days. For now, due to how the Pacific appears to be controlling the pattern, I would favor a Midwest/Great Lakes impact, but let's keep analyzing.

Tropical Tidbits
This graphic is the same type of forecast chart as the one we just discussed, but now comes from the Canadian ensembles, and is valid for November 25th. Despite this slight time difference, note that trough in the Central US, which could be our storm (though the timeframe's a bit fast for my liking). Once again, we see a positive PNA pattern, somewhat suppressed by lackluster ridging in the West US, but compensated by intensified ridging along the East. This would bend the storm track in favor of the Midwest and Ohio Valley for any big snows, and the Gulf Coast could then see some severe weather. Again, this will all sort itself out in due time, and this is merely something to watch for now.

IV. The Storm

It's all been leading up to this, folks. While I don't trust individual model guidance to show what the storm will be like (since it changes from forecast to forecast; no consistency), I would like to show the GFS ensembles' thoughts.

WeatherOnline
What you see above is a 'cluster' forecast from the GFS ensembles, valid on November 26th (technically the evening of the 25th in our time zones), forecasting precipitation and sea level pressure values over North America. I'll show the description of 'cluster' modelling below from the Weather Prediction Center, then I'll try to interpret it for others who may not understand at first.

Sometimes the ensemble members tend to group themselves into two or more solutions.  For example in the image above the ensembles cluster in two solutions off the Pacific NW coast  of the U.S. (a trough south of the Aleutian Islands and a trough off the Pacific Northwest coast of the U.S.).
CLUSTERING is an automated method that identifies and extracts like members and derives output from these like solutions (of which there are different methods to identify clusters).
If you didn't understand that, let's go through an example. Recall that the GFS ensembles have around 20 members, each of which produces its own, different forecast. Let's say that on November 26th, a certain number of ensembles are showing a relatively similar forecast. The 'cluster' method combines these similar forecasts, and does the same with other, like forecasts into 'clusters' of ensemble members. This allows us to narrow down how many ensembles are showing what type of solution for a certain time frame.

Going back to the GFS ensemble image above, approximately 30% of ensemble members' forecasts for this timeframe show a solution like the one above. This solution means a very strong storm would push north and east across the Midwest, like that positive PNA pattern may induce. The result? Heavy snow likely in parts of the Midwest and Great Lakes, while the South may see severe weather.
At first, you may think 30% is not that high. And you'd be right. But for a forecast 324 hours out, about a third of the ensembles showing this sort of solution isn't a bad thing to see if you're hoping for snow in the Central US.

Here's a good representation of what a scenario like the one above may result in.
I'm going on record and saying this is not a forecast! Please don't treat it as such!

Representation of one possible track for this storm.
Again, this is not a forecast, and it shouldn't be treated as such.
To summarize:

- Model guidance continues to support the idea of a strong storm system in the United States around Thanksgiving.
- The set-up for this storm looks to favor a storm track over the Central/East US.
- One model's representation might show heavy snow for the Midwest and Great Lakes.
- Low confidence, high caveats remain present.

Andrew