Tuesday, October 7, 2014

Historically-Accurate Pattern Predictor Suggests Cold Winter Ahead

A winter predictor that has had incredible success in past years, commonly referred to as the October Pattern Index (OPI), is supporting another cold winter ahead.

The above image shows anomalies of the October Pattern Index over the last several days, since the start of October. The OPI, the concept of which was brought about by a group of Italian scientists, says that monitoring of the atmosphere during the month of October can yield great hints at what the coming winter will bring. October is a month well-known for big winter-predictors showing their cards for the coming cold season (i.e. the LRC, and Judah Cohen's Snow Advance Index (SAI)), but it may interest many to know what the OPI may be one the best, if not the best predictor of the upcoming winter season out of the three mentioned above.

The explanation page of the OPI tells of the index's incredible accuracy, around 90%, of being able to predict the December-January-February Arctic Oscillation. In the winter, a negative phase of the Arctic Oscillation (AO) means the polar vortex is weak and is more prone to sending cold outbreaks to the mid-latitudes, while a positive AO indicates a strong polar vortex, hence a warmer winter increases in probability.

Though we aren't to the middle of October yet, early indications are that the OPI is sustained in a negative phase, today plummeting below -3, off the chart as shown above. If the OPI stays in that negative territory for the rest of October, chances are the winter may have a negative Arctic Oscillation. The AO doesn't define the winter in terms of cold overall, but it can give a good hint at the temperature pattern for the coming winter.

Andrew

Friday, October 3, 2014

October 10-15 Potential Wintry Storm, LRC Implications

The potential for a wintry storm in the October 10-15 period is being monitored, as well as its impacts on the new Lezak Recurring Cycle.

Instant Weather Maps
The image above shows the GFS model forecasted precipitation, mean sea level pressure values, and 850 temperature contours for the date of October 10th. In this graphic, we can see a storm system pushing north through the Midwest and Ohio Valley dropping impressive rains over Illinois, Indiana, Ohio, and parts of Michigan. However, the 850mb temps appear to be near to just below freezing over central Michigan, where we see a rather sharp cutoff in the precipitation shield.

The 850mb level, located about 5,000 feet off the ground, being below freezing can indicate snow... in certain situations. The temperature profiles for the atmosphere in general in central Michigan, where snow appears the most "likely" to occur ("likely", in this situation meaning not too likely), aren't favorable for much wintry precipitation. Despite this, the backside of this storm could drag down some cold air, which might allow for some flakes to fly in parts of the North/Central US.

As for the Lezak Recurring Cycle, it has been indicated that this is part of the new pattern. To paraphrase what the founder of the LRC concept, Gary Lezak, said, the new 2014-2015 LRC pattern is now becoming visible. Depending on how the rest of the month evolves, this storm system could be one we see repeating in the future as potentially a pretty good winter storm.

Unless future forecasts raise the risk of wintry precipitation, this may be the last update on this system.

Andrew

Long Range Lookout: Persistent Cold May Lead to Early-Season Snow

Upcoming spells of rather persistent cold may bring about the risk for some snowfall as we push into October.

CMC
The image above shows 500mb height contours from the Canadian model ensembles, valid about four days from today. In this graphic, we see a strong cold weather signal evolving over the United States. Suppressed ridging looks to form over the Western US, as the arcing motion of the contour lines show. Storminess over Alaska and western Canada look to keep a lid on that ridging, but we then see a body of strong ridging shooting up into Greenland, near the top-right corner of the graphic. It is this ridging that permits a strong upper level low to shift south from far northern Canada, buckling the jet stream south and allowing cold air to flow south into the United States. The depressed 500mb height contours confirm this proposition.

The potential for snow comes about from that stormy Gulf of Alaska, where pieces of energy may break off and surge into North America, possibly plummeting into the Plains and giving precipitation to the Central/East US.

CMC
Fast forward five days, now at the 9-day forecast window, and we still see a prevailing cold-weather signal from the CMC ensembles. Per the image above, the Canadian ensembles are expecting the strong ridging near Greenland to break down, eventually transitioning to zonal (not 'wavy', generally quiet weather) flow in the northern Atlantic. The West US now provokes this cold air potential, as that aforementioned suppressed ridging starts to build north into Canada. This change from a suppressed ridge to a building ridge is reflected well by the tilting of the depressed 500mb contours from east to west, giving the Upper Midwest and North Plains some chilly weather, sparing the East.

PSU
The cold weather signals continue, even out into the Day 14 outlook. The image above shows each individual member of the GFS ensemble system, and its forecasted temperature anomalies about 13 days from today over North America. The big panel at the top of this image shows the average temperature anomalies from all of these individual members, and per this average, we can see the slightly below-normal temperature anomalies pushing south from Canada, possibly continuing this pretty cold pattern we look to enter.

To summarize, a chilly pattern looks to envelop the United States in the next several days, persisting for a decent period of time. This cold may bring the risk for snowfall in areas where the cold air and any possible storm systems collide.

Andrew

Wednesday, October 1, 2014

October 11-15 Potential Winter Storm

It appears the Central and Eastern US may see a wintry storm system push through around an October 11th to 15th timeframe.

Tropical Tidbits
The image above shows the 500mb height anomaly forecast from the GFS model, valid on October 5th. Blues on this graphic indicate negative height anomalies, which typically bring about cold and stormy conditions. Oranges and reds depict warmth and generally tranquil conditions.

On the image above, we see a typhoon pushing north into the nation of Japan on October 5th, appearing to just miss a merge with the trough to the west of the country. This typhoon looks to hit Japan head-on from this forecast image.

This all plays into our winter storm threat using the concept that weather phenomena that occurs in Japan is reciprocated 6-10 days later in North America / after it happens in Japan. For example, this typhoon hitting Japan looks to induce a period of cold and stormy weather in the US 6-10 days after it his Japan, which puts us on track for a storm system in the US around an October 11th-15th time period.

Instant Weather Maps
Model guidance is already showing signs of this storm hitting the United States. This GFS model forecast, made at the same time as the image at the top of this post, shows precipitation on the morning of October 12th, along with 1000-500mb thickness values. A rule of thumb is that values below 540 on the image above indicate where snow (or other wintry precipitation) is possible. The GFS model shows sub-540 values spread across the Midwest and Great Lakes, meaning we could see some wintry precipitation in those areas.

Surface temperatures aren't conducive for snowfall, but I wouldn't be surprised for some parts of the Central and East US to see wintry weather, possibly including snowfall in the coldest area, when this storm threat rolls around during the October 11-15 period.

Andrew

Tuesday, September 30, 2014

Weak Stratospheric Warmings Suggest Turbulent Winter Ahead

The first substantial stratospheric warming event appears to be underway in the Northern Hemisphere, and could be a signal for what's ahead this winter.

CPC
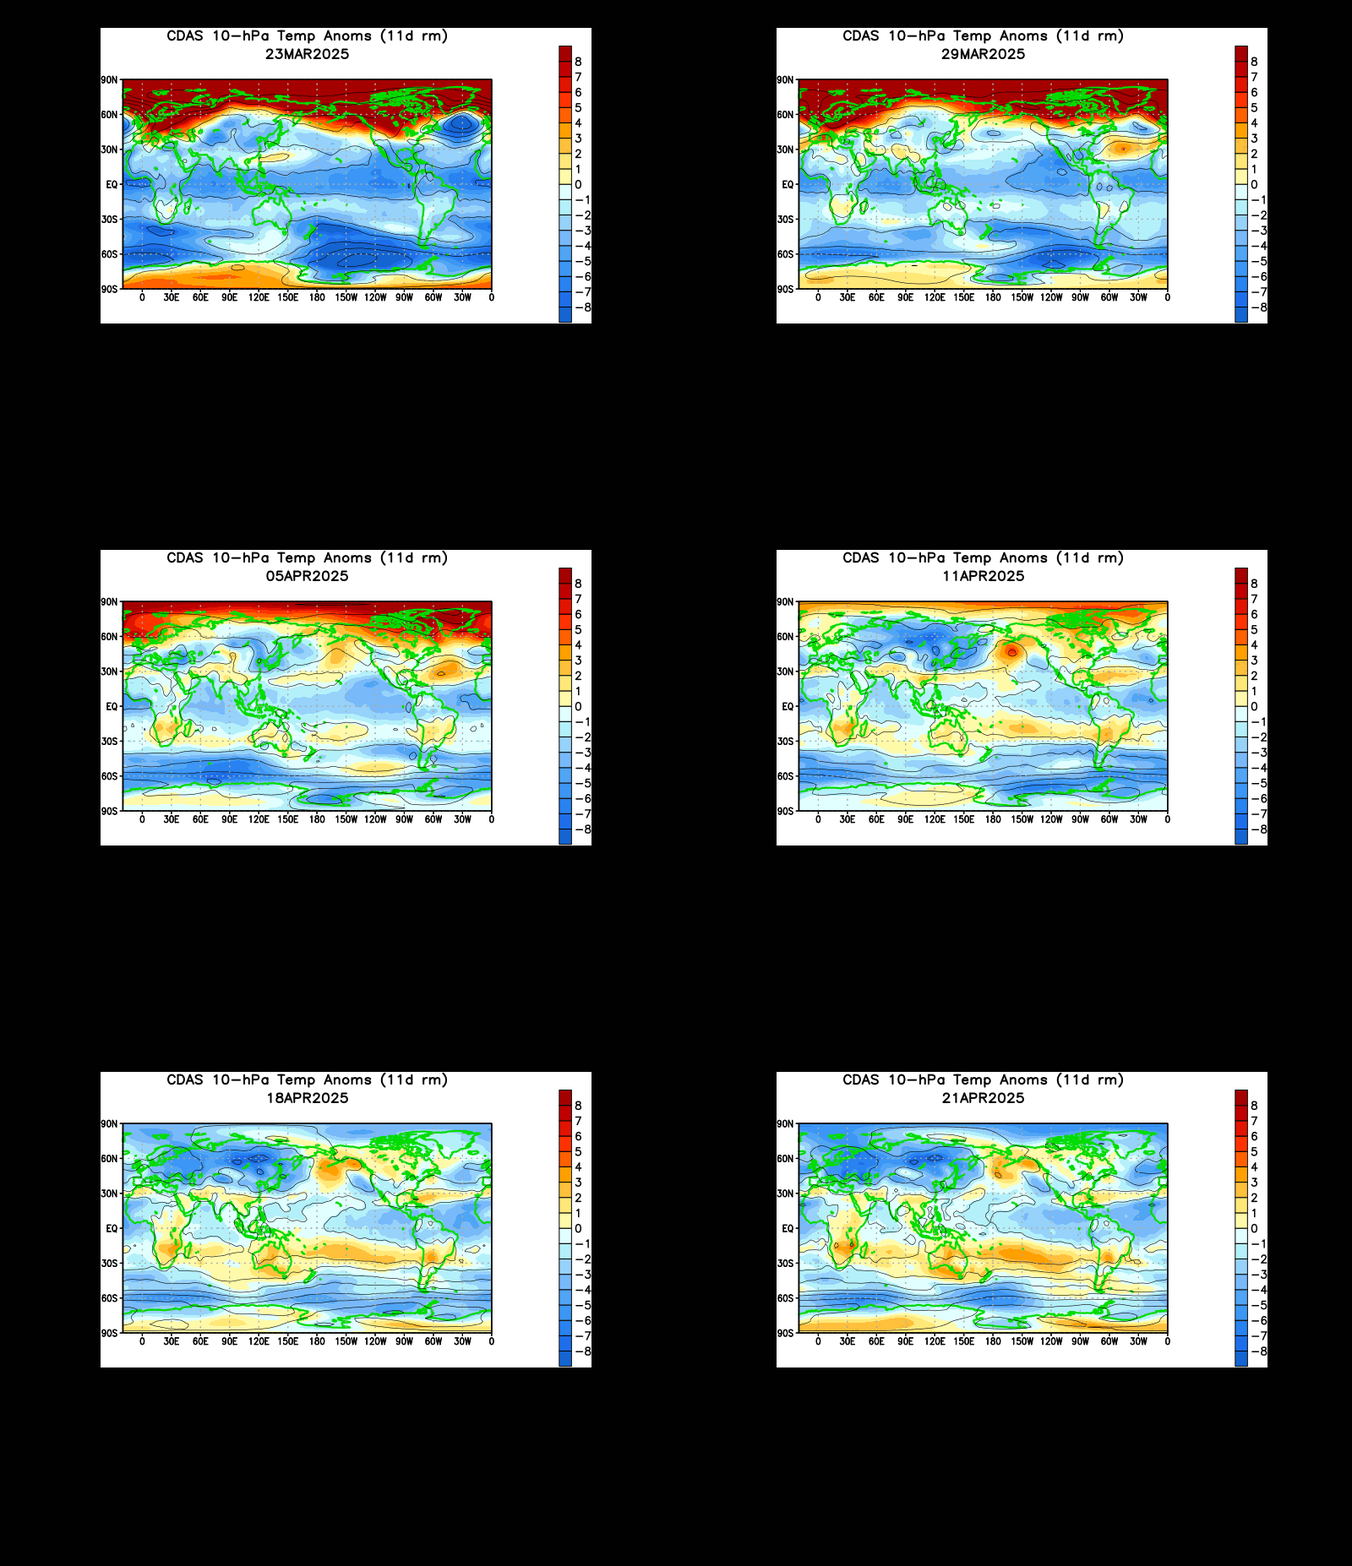
The animation above shows temperature anomalies at the 10 millibar level of the stratosphere across the world over the past month. The Southern Hemisphere has been on the receiving end of more than one powerful sudden stratospheric warming (SSW) event, but we'll focus our attention on the Northern Hemisphere for now.

Take a look at what's been happening over Canada and into Greenland in recent days. We've been seeing warmer than normal temperature anomalies push northward from Canada into Greenland, and now across the Arctic Circle. In the winter, when these events happen, outbreaks of cold air may be expected at lower latitudes approximately 2-4 weeks after the event. This warming is pretty minor, so I wouldn't expect any significant cold to come from it, but there's more to this whole process.

CPC
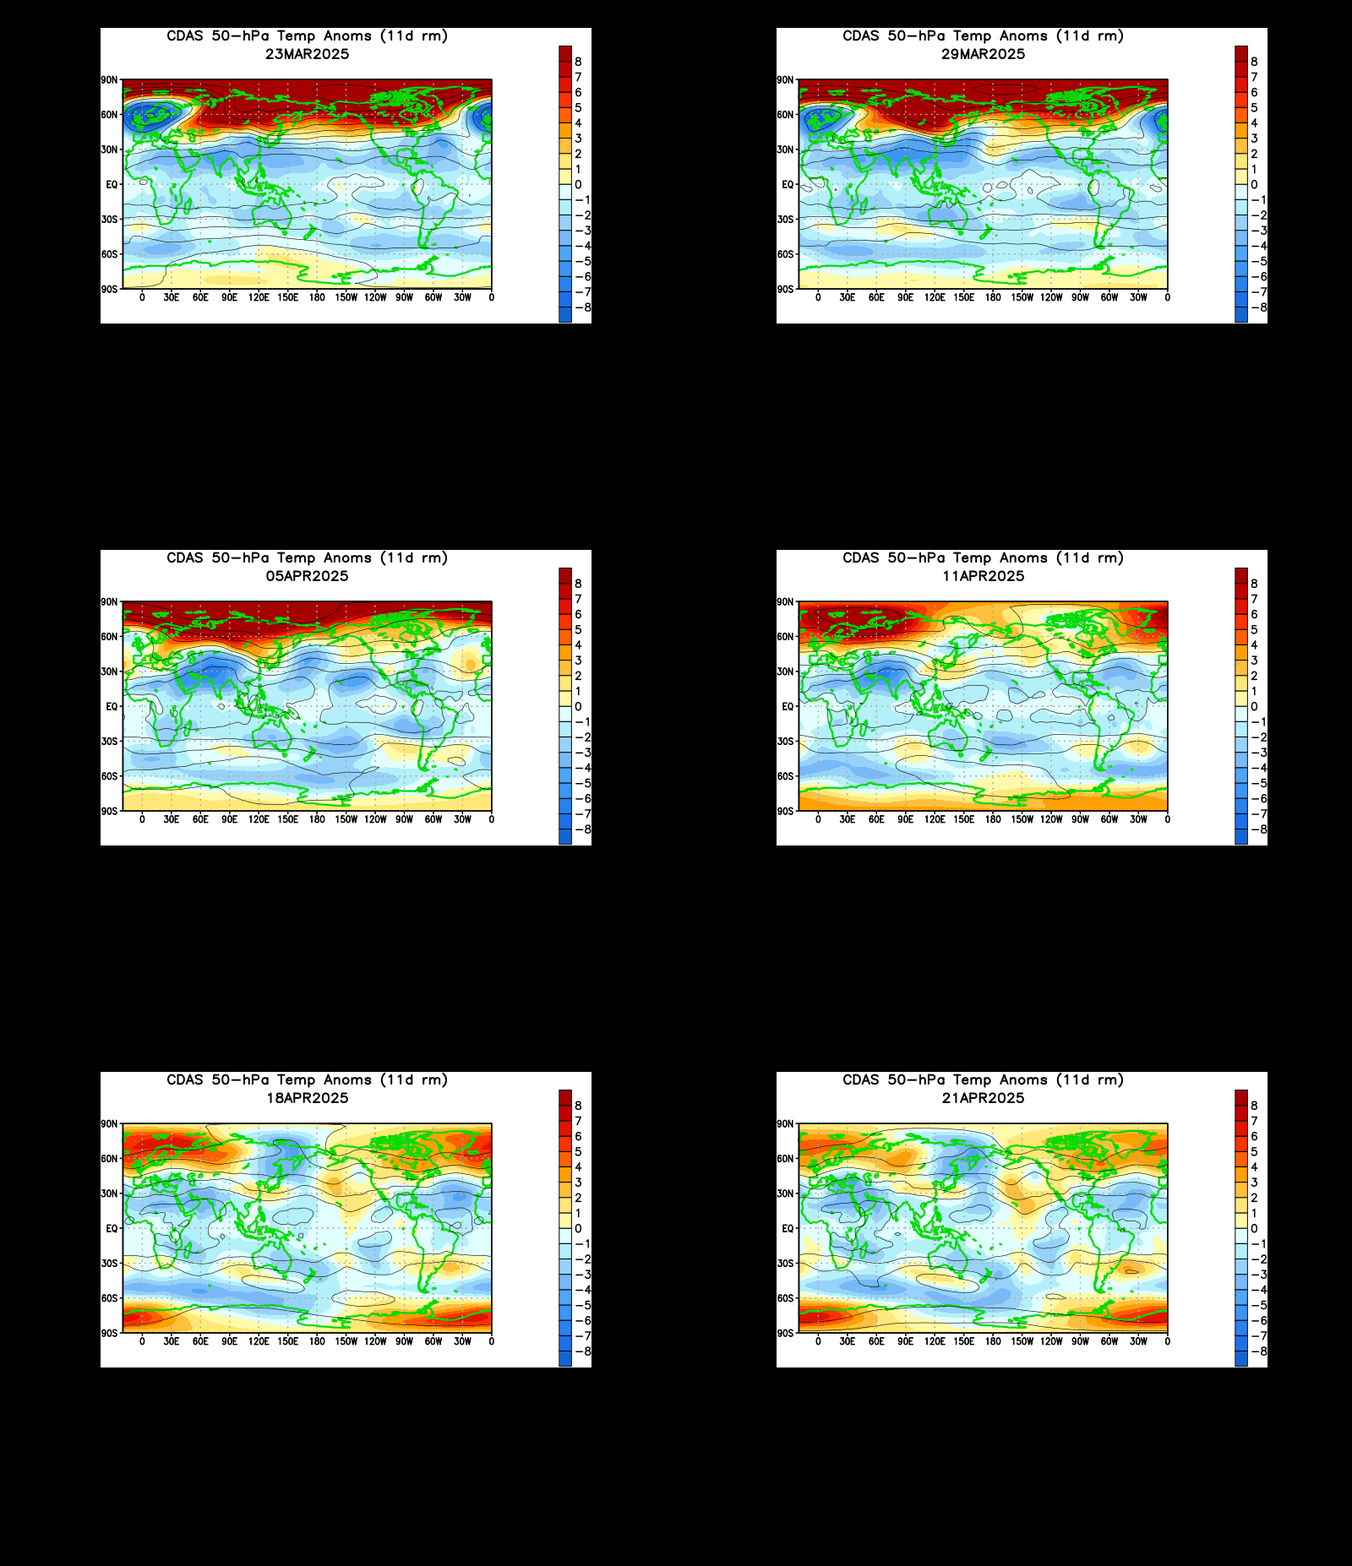
If we look at the same animation, now at the 50 millibar level of the stratosphere (generally considered the middle of the stratosphere), we still see that swath of warmth pushing north from Canada into Greenland, and actually extending westward into the Pacific as the warmth is shoved into the Arctic. The presence of this warmth across the upper and middle stratosphere means that this isn't just a fluke warming, but in terms of an early-season stratospheric warming event, this one's pretty substantial.

All of this may be hinting at what kind of winter we'll see this season. If the stratosphere is already rather vulnerable to warm air invasions, it could mean that the polar vortex, which spans the troposphere and stratosphere, may be weakened significantly this winter, possibly leading to more frequent wintry outbreaks. The chance of this polar vortex weakening is raised by the expectation for stratospheric winds to be unfavorable for the formation of a strong polar vortex.

More on this will be analyzed in the near future.

Andrew