As we close out the winter of 2013-2014, I suppose it's time we start looking at forecasts for the El Nino-Southern Oscillation (ENSO) phenomenon for this summer to see what ENSO state we may see in the winter of 2014-2015.
Before we begin, let's establish what the El Nino-Southern Oscillation is.
The El Nino-Southern Oscillation (ENSO) phenomenon involves sea surface temperature anomalies over a portion of the Equatorial Pacific, namely focusing on the waters west of Colombia and Ecuador. In the image above, the Climate Prediction Center shows distinct El Nino environments (left two panels) and La Nina environments (right panels). During an El Nino, water temperatures to the west of Ecuador usually warm up significantly. These warm temperatures then produce anomalously high levels of tropical convection (as warm waters make air rise, creating thunderstorms), and the whole process leads to an El Nino pattern. During a La Nina, we see the opposite, where colder than normal water temperatures are observed, leading to anomalously low levels of tropical convection. As you can see by the image below, the El Nino patterns and La Nina patterns during the winter months have different impacts on the US.
Now that we know what the ENSO phenomenon is, let's move on to the model forecasts.

We'll begin with the NCEP's CFS model. The CFS projects monthly and seasonal values for the ENSO phenomenon, and also gives out precipitation, SST, temperature, etc. forecasts for the world. The CFS model indicates we will see steady rising of sea surface temperatures in the Equatorial Pacific throughout the spring, summer and beginning of fall, before we reach SST temperature anomalies above 1 degree Kelvin, which is equal to over 1.8 degrees Fahrenheit. This would qualify as a strong El Nino, something we haven't seen for a while (we have been in an unprecedented lack of El Nino events since 2010; the four-year stretch since 2010 has included neutral ENSO and La Nina events). This strong El Nino would then likely continue on into the winter of 2014-2015. However, because the CFS model is notorious for forecasting an El Nino that never comes true, I'm not buying this forecast. While I do believe we see an El Nino event by this summer 2014, I don't believe it will be a strong El Nino.

Next, we will continue with the ECMWF model's forecast. The ECMWF model projects the ENSO phenomenon out to roughly 6 months forecast time, and uses its prestigious 52-member ensemble prediction system in its forecast. The ECMWF model also projects that we will see an El Nino by the summer, though its rise to an El Nino is more exponential than linear- we saw the steady rising trend in sea surface temperature anomalies (SSTAs) in a linear fashion by the CFS, and now we see an exponential increase in SSTAs around May and June 2014. By July 2014, ECMWF ensemble guidance has water temperatures at 1 degree Celsius above normal, which equates to 1.8 degrees Fahrenheit above normal. This would also qualify as a strong El Nino, but once again, I'm skeptical of these strong El Nino forecasts. While they're possible, I'm not so sure they're probable.

Next, we'll take a look at the Japanese ENSO model prediction. The Japanese model forecasts the ENSO phenomenon out to just after July 2014, about the same forecast time period as the ECMWF model. The Japanese model goes for a forecast similar to the ECMWF, where we see a jump in SSTAs around May and June, before arriving in the ~0.8 to 0.9 degree Celsius anomaly. That would constitute an El Nino, though it would be weaker than projections by the CFS and ECMWF. I find this forecast much more logical- it's always a gamble when you go with strong El Nino or strong La Nina forecasts. Usually its better to go with a weaker, albeit still substantial forecast.

Next up is the Australian Bureau of Meteorology's POAMA model. The POAMA model projects the ENSO phenomenon out to October, with a forecast time period of roughly 8 months. The POAMA model takes the current cool-neutral ENSO state to neutral by June, and borderline-El Nino by October. This forecast might be a little too weak with the idea of an El Nino- I wouldn't be surprised to see an El Nino declared by late summer (around August or September). However, the POAMA does give us a glimpse at the other side of the forecast envelope, when comparing it to the bullish ECMWF/CFS forecasts.

Next, we'll take a brief glance at this trio of forecasts. These three forecasts are under the LDEO model domain, which gives forecasts out to December 2014, meaning its forecast time period is roughly 1 year when we see that the red observation line stops at December 2013. In these three projections, we see that a weak El Nino or warm-neutral ENSO state is favored by the winter of 2014-2015. I expect we see an El Nino by this time, so these models may be a little too under-aggressive with this situation.

The next item to analyze is the NMME model suite. The NMME is a compilation of various global model guidance systems, all of which project the ENSO phenomenon using an ensemble set out to 8 months. In this graphic, we see the projected ENSO values by operational and ensemble members from the CFS model (red), two separate versions of the CMC model (CMC1 in green and CMC2 in navy blue), the GFDL model (light blue), NASA's model (pink), NCAR's model (yellow), and the NMME suite mean (black dashed line). The NMME suite is in decent agreement on a steady rise to El Nino conditions by the end of summer, something I do believe is likely. The NMME mean has the El Nino in weak to moderate condition by August, something I think is more probable than possible, especially considering history would suggest an El Nino is long overdue this next winter. In summary, I agree with the NMME projection.

The next suite of models to observe comes from the International Research Institute for Climate and Society. These models project the ENSO phenomenon out to the August-September-October period, meaning the forecast timeframe is around 10 months. This graphic gives us a look at a variety of model guidance systems from around the world. Each different model is displayed in a different color, with the average ENSO prediction shown in the solid yellow line. We see that the ensemble prints out a borderline-El Nino by the fall months. Considering we are almost certainly heading towards an El Nino next winter, this forecast is a good median in the envelope of forecast models.

This final model shows the SST anomaly forecast for the December-January-February 2014-2015 period from the SCRIPPS institute. The SCRIPPS institute model projects the ENSO Phenomenon out to this DJF period. We can see that the model shows a strong El Nino by late winter. As I've gone through all of these models, some of which have been showing a strong El Nino, I still hold my belief that these models are likely too strong, and a weak to moderate El Nino is more likely. These details will be cleared up in the months ahead, of course.
Andrew

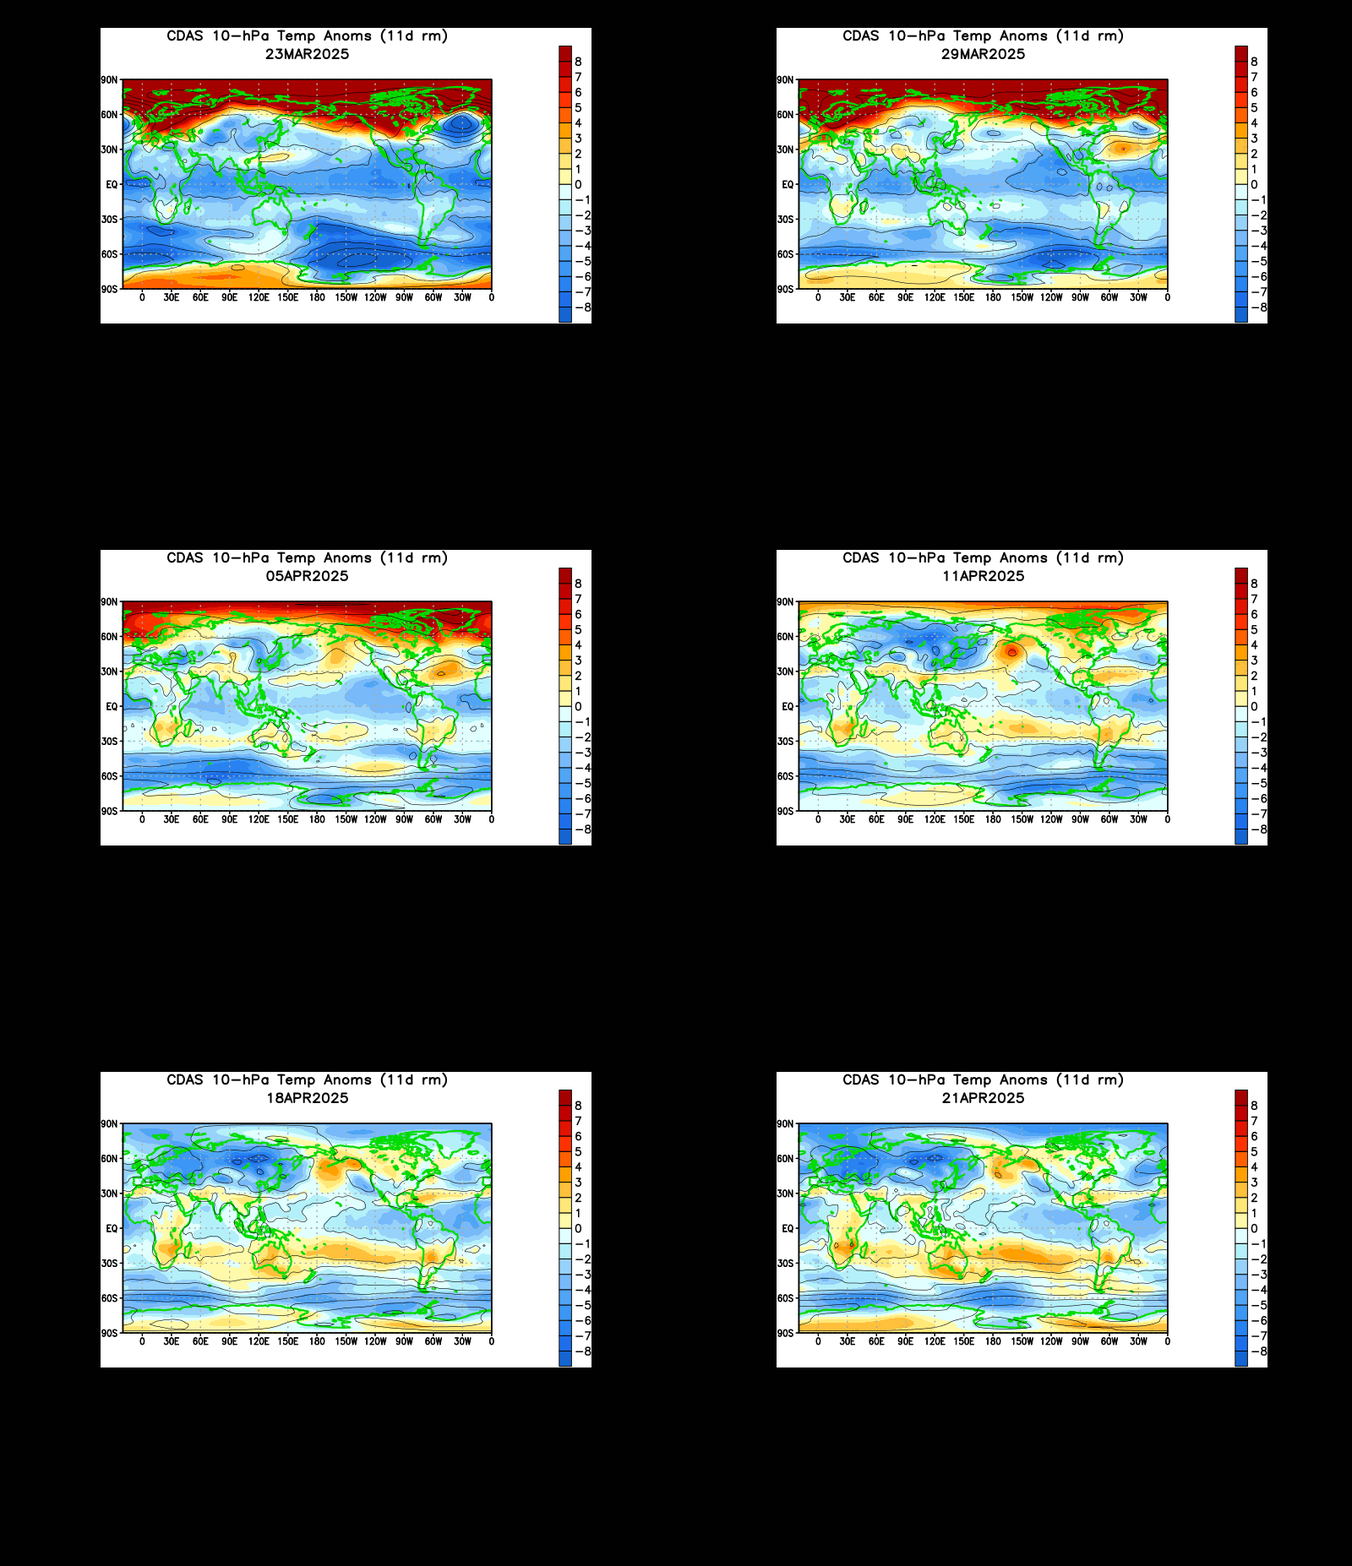
 The animation above shows us temperature anomalies in the 10 millibar level of the atmosphere, which is located way up in the upper stratosphere. We see how the stratosphere has been rumbling since mid-January with attempts at a stratospheric warming event, but it is only as of the last few days that the stratosphere saw a massive warming event, titled a sudden stratospheric warming (SSW) event. To see how big this event is, let's head down to the 30 millibar level, located further down in the atmosphere compared to the 10mb level.
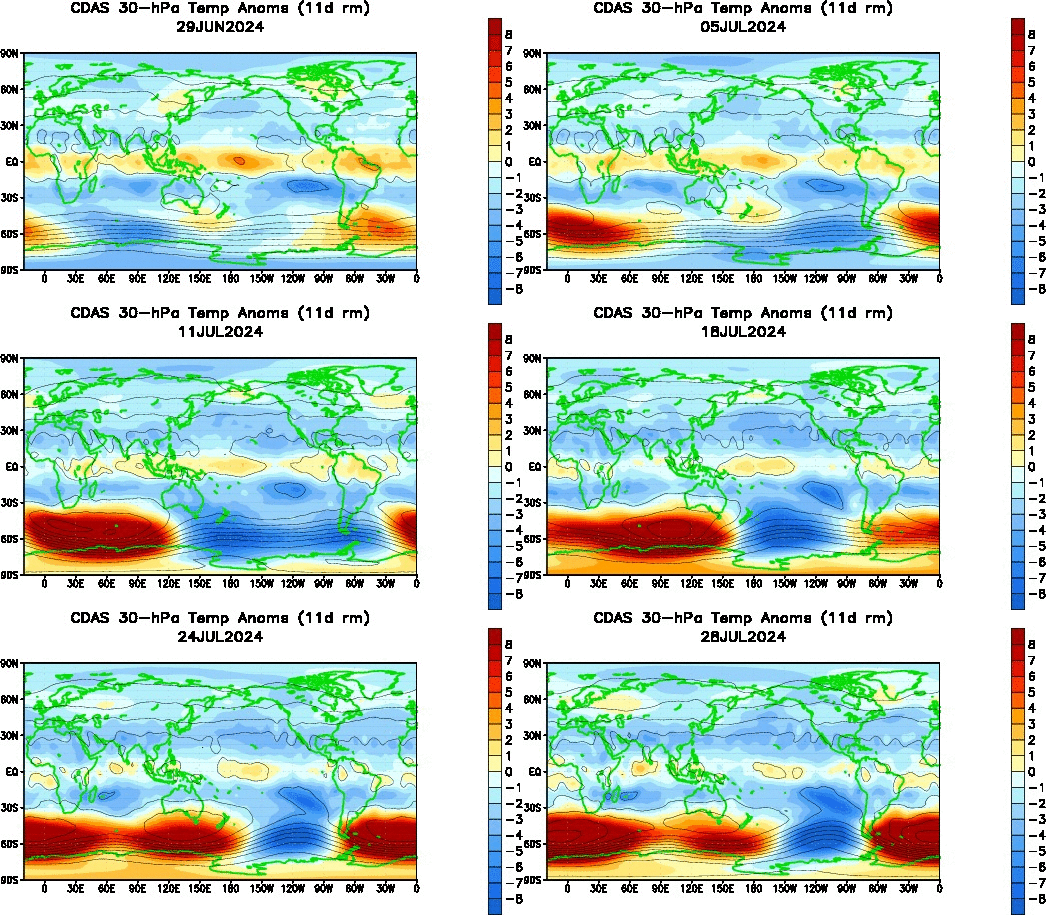
 The 30mb temperature anomaly animation above shows how the stratospheric polar vortex has been under attack for a longer period of time compared to the upper stratosphere. We see a large swath of warmth had been developing and manifesting itself in Eurasia in January into February before finally bursting into the upper latitudes. It is now clear that the sudden stratospheric warming event has extended itself into a decent chunk of the stratosphere. Let's check up on the 50 millibar level next.
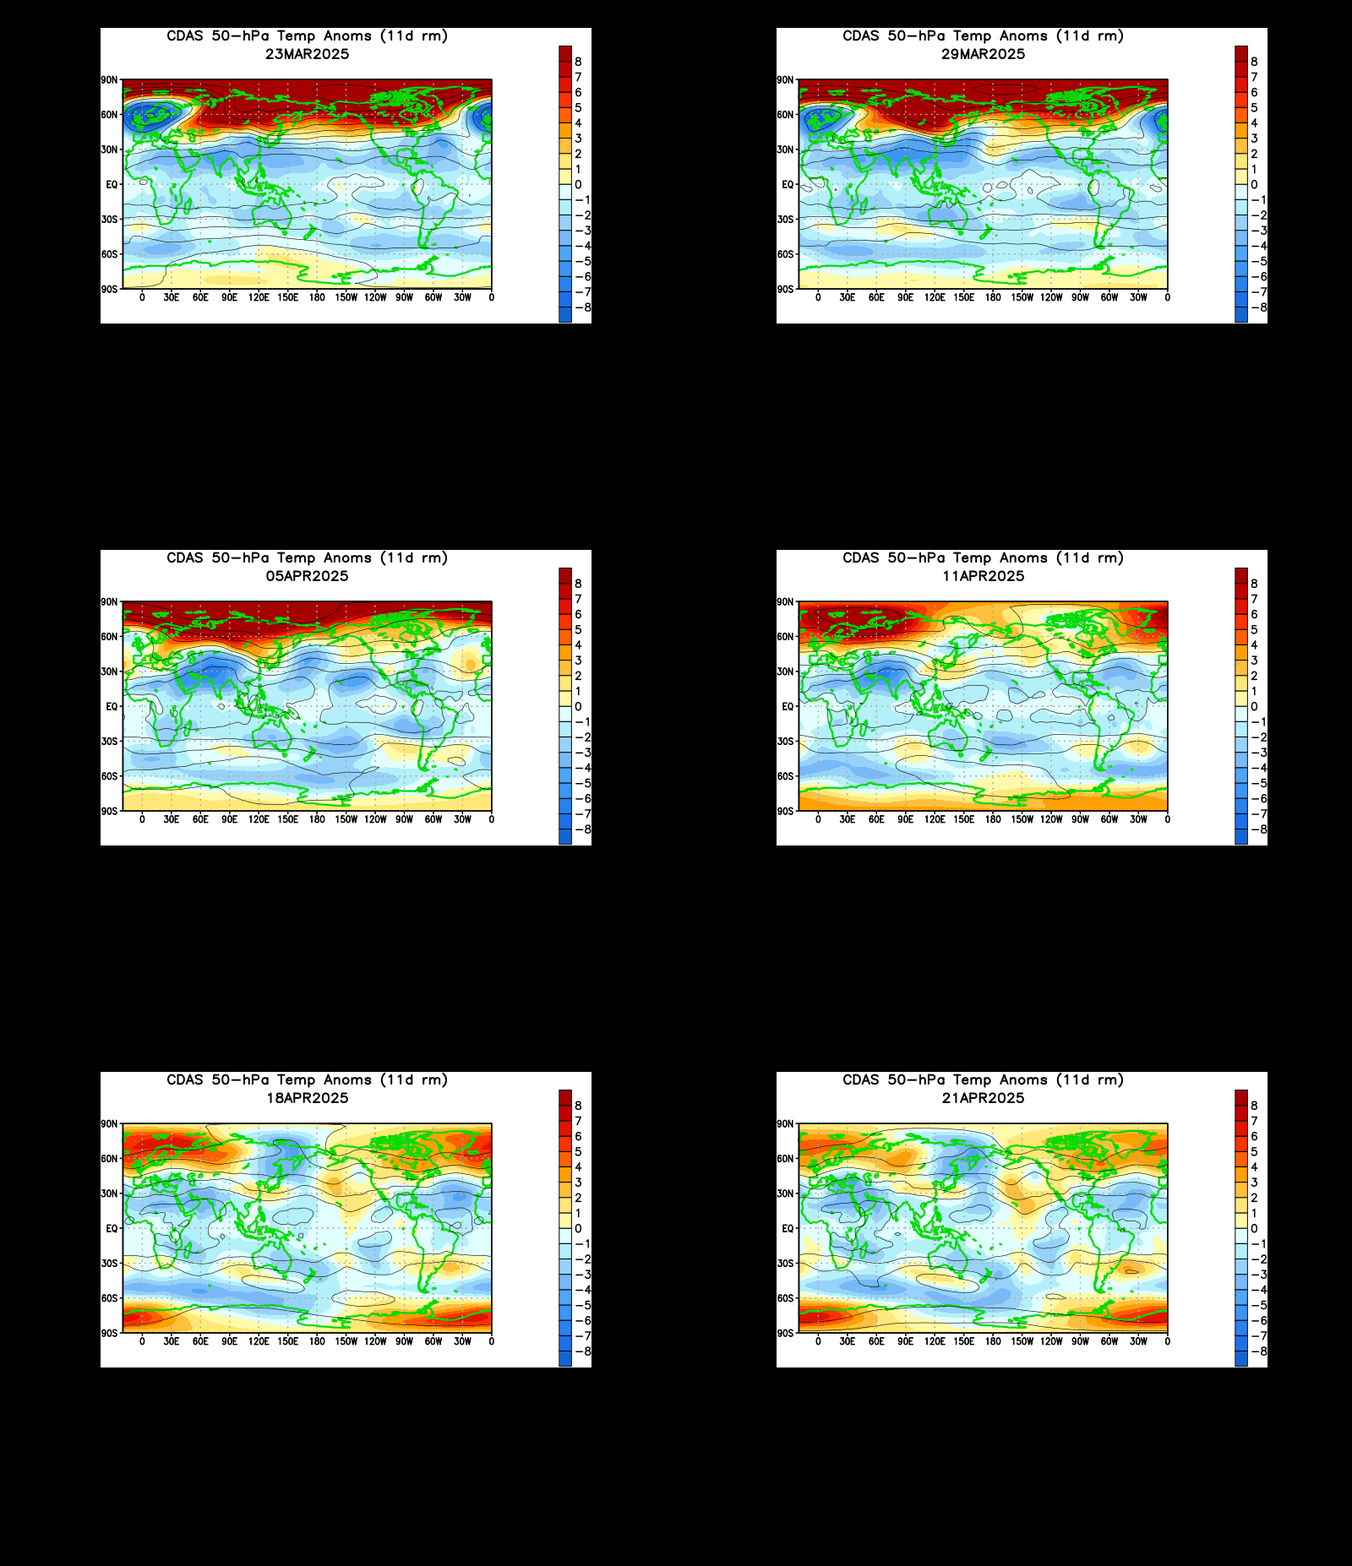
 The 50mb level is also seeing significant warming in the upper latitudes, which only confirms the idea that this is indeed a sudden stratospheric warming event, quite possibly the first one we've seen this whole season.
 The ECMWF model sees this intrusion on the stratosphere continuing, forecasting continued elevated geopotential-Wave 1 activity at the 10 day forecast period. We see the elevated values maximized around the 3mb to 30mb levels, with lesser influences downwelling as low as the 500mb level. It is likely that this will be the biggest stratospheric intrusion this season, as we are just about to wrap up the meteorological winter season, and the "final warming" (where polar winds reverse to signal the end of the SSW season) isn't too far away.