Showing posts with label Northern Hemisphere. Show all posts

Tuesday, March 18, 2014

Stratospheric Polar Vortex Collapsing; Final Warming Occurring?

We're going through a collapse of the upper stratospheric polar vortex at this moment, and it's now possible that we are seeing the Final Warming event occurring.

The image above shows a six-panel graphic, each marking a day's observation of zonal wind anomalies by latitude, as the legend on the bottom shows, and by height in millibars, as the legend on the left shows. Going from the top row of panels to the bottom row, from least to most recent, we see a notable and rather sudden drop in positive zonal wind anomalies in the upper right-hand corner. Looking closer, we find this drop in anomalies over the 1 to 10 millibar level, in the highest reaches of the stratosphere (remember that we are based at roughly the 1000 millibar level, so 1 millibar is far higher than even what planes cruise at). Now, this transition from orange colors to blue colors in the top right hand corner of the most recent observation, marked under March 15 2014 means that the winds have reversed. In the Northern Hemisphere, positive zonal winds are also known as 'westerlies', as they move to the east in a counterclockwise formation. That is why we look for areas of positive zonal winds to identify the polar vortex in the stratosphere, because the polar vortex is essentially just one big low pressure system. In the same sense, negative zonal wind anomalies define 'easterly' winds, as they blow towards the west. Recall that high pressure winds spin to the west in a clockwise motion, providing the reason why we look for negative zonal winds to tell if the polar vortex has weakened. In this case, rather than the positive zonal winds just weakening a bit, it looks like they completely reversed in the far upper stratosphere, marking a collapse of the polar vortex at that level. Also note the lack of strong zonal winds in the mid and lower stratosphere, also indicative of a very fragile polar vortex.

An analysis of the 1 millibar level's temperature and height contours tells the story. In this view, covering the Northern Hemisphere (if you look closely you can see the continent outlines in white), we see high pressure duking it out with low pressure-- and winning. The high pressure has taken over the Arctic Circle, pushing the upper stratospheric polar vortex to the south. The swath of warmer than normal temperatures is also helping to weaken the polar vortex to the point that those zonal winds have reversed, meaning the polar vortex has fallen.


Let's take a look at another multi-panel graphic to get an even better handle on this situation. On the top panel, we see something we're already familiar with- the turquoise line denotes zonal wind values at the 1 millibar level, and the prominent dashed line indicates the separation line between positive zonal winds (upwards from the dashed line), and negative zonal winds (downwards from the dashed line). This graph tells us that as of late, zonal winds at the 1 millibar level have been sustained at negative levels, confirming this idea that the winds have reversed in the upper stratosphere, leading to a failure of the polar vortex. The panel just below that one shows us zonal winds for the 10 millibar level (blue) and the 30 millibar level (red). While these two levels are not seeing negative zonal winds, they're awfully close to zero on that graph, and that tells me something else is going on here. I'm led to believe that we are now under a final warming warning, if you will.

In the winter, there are sudden stratospheric warming (SSW) events that see massive quantities of warm air shoved up into the stratosphere, disrupting the polar vortex and sending frigid air down to lower latitudes, such as Eurasia and North America. However, in late winter or early spring, we see a massive warming event that reverses zonal winds to negative values for the summer. This means that we see the polar vortex disintegrate for the summer, replaced by dominant high pressure. This process is natural and happens every year. Now that we're in March, and we're seeing a stratospheric warming event that looks like it's dragging down positive zonal winds across the stratosphere to zero or negative values, it looks to me that this could very well be the Final Warming for the winter, heralding the end to the winter of 2013-2014 (at least in the stratosphere).

The 10 day ECMWF zonal wind forecast, the same format as we saw in the six-panel image at the top of this post (except valid 10 days from today), gives a prognosis that the Final Warming is either occurring or will occur soon. Even 10 days from now, we see slightly negative zonal winds now extending from the top of the stratosphere down to the 20 millibar level. Yes, we see a spot of positive zonal winds centered around the 30 millibar level on the right side of the graphic, but no big rebound to a strong polar vortex in 10 days' time tells me the stratosphere is shutting down for the summer.

This means, in layman terms, that winter could be over in just 2-4 weeks. It might seem like a long time, but it's better than not knowing if it will end at all, right?

Andrew

Saturday, February 15, 2014

Long Range Discussion: Severe Weather, Snowstorms To Kick Off March

This long range discussion will focus on the expected weather to end February and kick off March.

The image above shows the latest 500mb height anomalies across the Northern Hemisphere on the left, with cloud cover, pressure contours and high/low pressure denotations on the right. If you've been with The Weather Centre for a while, you know how we use a rule created by Joe Renken that states a storm system in East Asia then results in a storm in the United States 6-10 days later. This situation is no different- today, we saw ridging/high pressure emerge in East Asia. If we extrapolate that out 6-10 days, we arrive at a warm-up in the February 20-24 timeframe. I'll discuss this more a little later down this post.

Lately, as the image above shows, the weather pattern has been dominated by west-northwest to northwest flow, thanks to deep troughing in the Gulf of Alaska and suppressed ridging in the Southwest producing a pattern favorable for East Coast snow events. This whole pattern is expected to flip in the medium range.

The changes begin as ensemble members foresee strong ridging shifting east into far eastern Russia, which will then shift the Gulf of Alaska storminess to the east, resulting in the loss of high pressure in the Southwest US. That Southwest ridging then propagates east into the contiguous United States, producing mainly zonal flow, which keeps anomalous warm or cold outbreaks out of the picture. However, with the ridging now gone, the storminess in the Gulf of Alaska can drop south into the Western US. The result is a stormy West US, and a very warm East US.

Model guidance (with the exception of the CMC model on the far right) is in agreement on a pattern change evolving, where we see the troughing drop south into the West US, as high pressure prevails yet again in the Gulf of Alaska. The storminess in the West US isn't as well defined on the ECMWF forecast (left) or GFS forecast (center), primarily because this image shows projected 500mb anomalies over the 8-10 day forecast period. This means the forecasts may seem a little less 'intense' than they end up being, because the anomalies are averaged out over a 2 day period, rather than a 6 hour period like most models print out.

Regardless, the pattern will involve high pressure setting up along the East Coast in response to troughing out West, and this sort of pattern just screams for not only a snow event, but a severe weather event. We will see anomalously warm and humid conditions present across the Central and Eastern US as the jet stream bends north to accommodate for the ridging out East. This ridge also tells me we should keep an eye out for a storm system cutting north through the western Great Lakes, something model guidance is already picking up on. I have a feeling such a storm cutting north would result in not only a northern Plains snowstorm, but also a severe weather event for the Central US, something I discussed in yesterday's post.

As we head into the last days of February, ensembles give the Central and East US another shot of cold weather, as shown by the GFS Ensembles' portrayal of the trough at the 500mb level on the left panel. Again, the pattern we discussed above would strongly support this solution. It wouldn't surprise me to see additional chances for storms, both snowy and severe, before the month of February ends, apart from that other storm system we discussed yesterday in the link above.

For the opening days of March, I wouldn't be surprised to see us start on a chilly note before rebounding to rather seasonal temperatures. Depending on how the sudden stratospheric warming event continues to evolve, we could be looking at a cool March, though the chance of that would be maximized in the north-central US (primarily the Plains), and minimized along the East Coast and West Coast, where ridging and warm weather would be expected.

Andrew

Friday, February 14, 2014

Sudden Stratospheric Warming Commences in Northern Hemisphere

The winter's most sizable sudden stratospheric warming event to date has commenced.

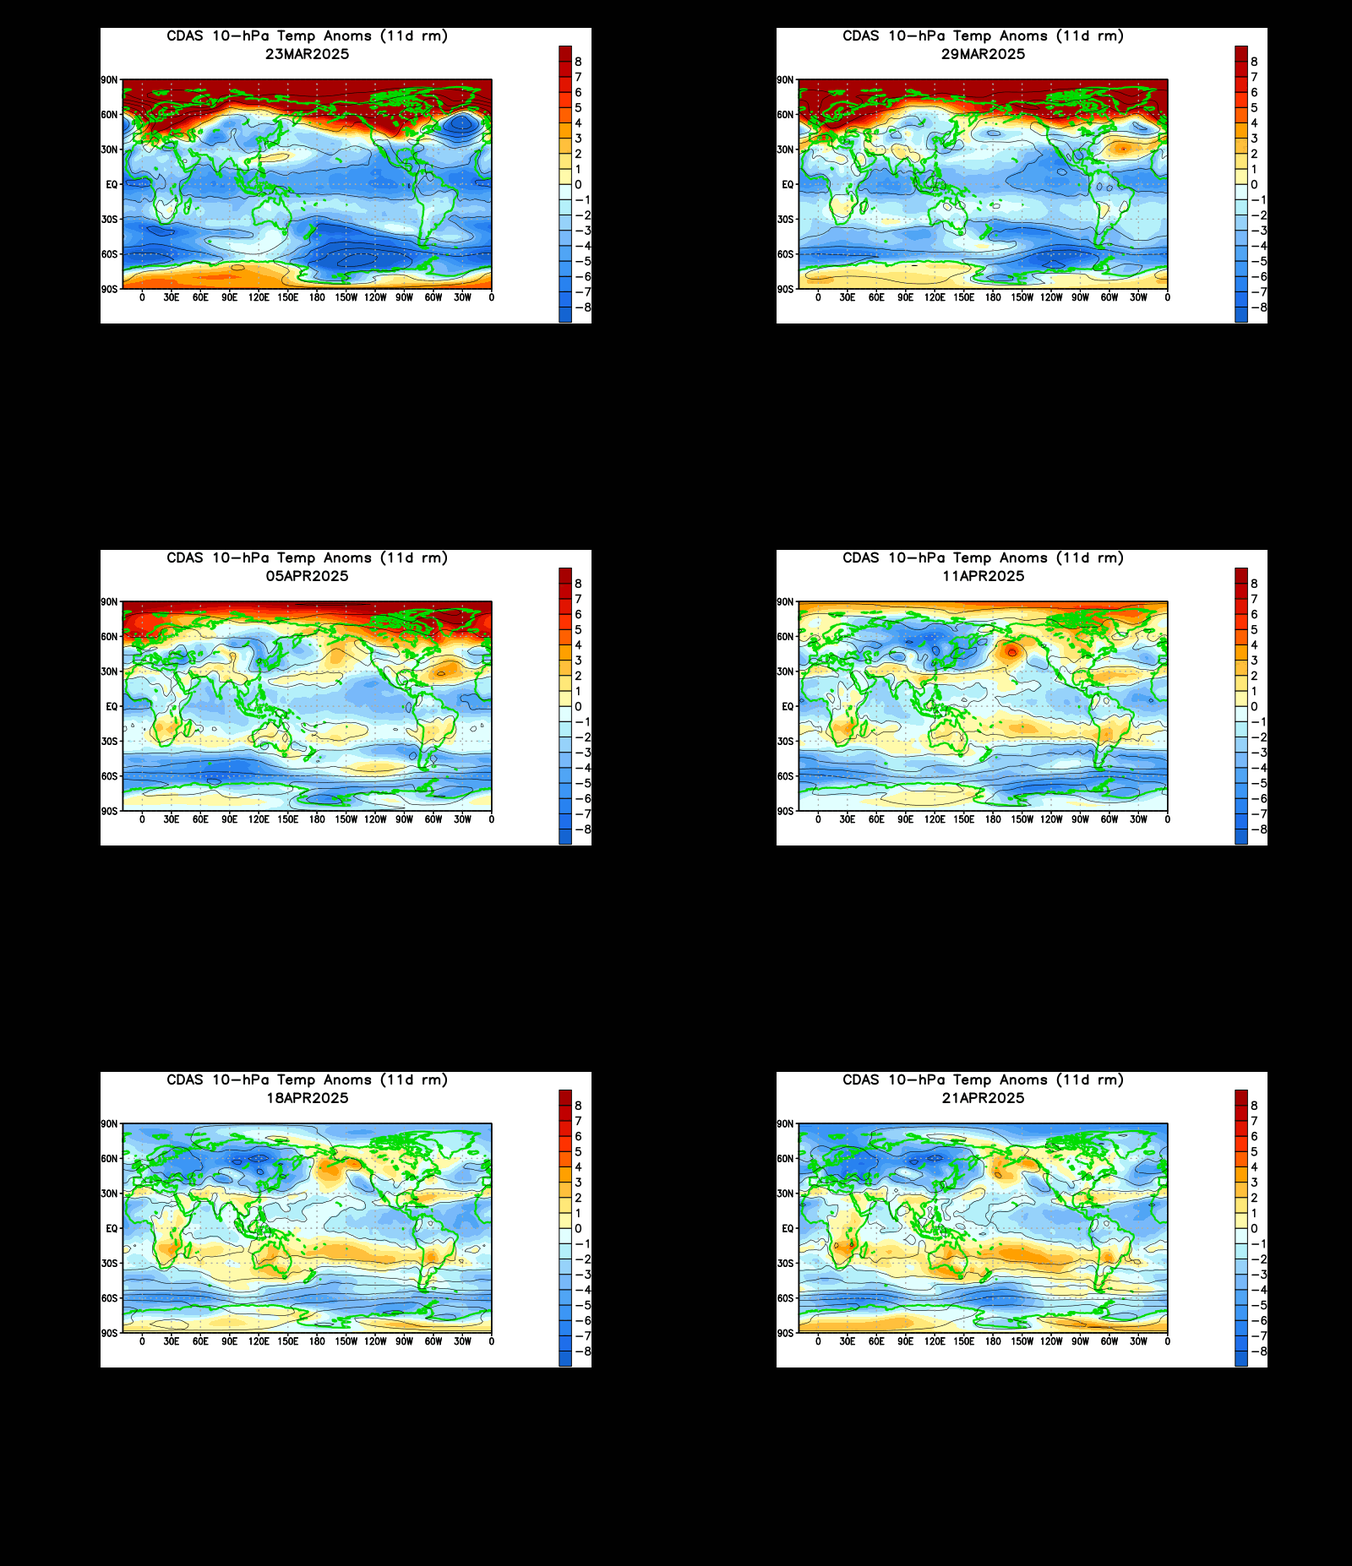
The animation above shows us temperature anomalies in the 10 millibar level of the atmosphere, which is located way up in the upper stratosphere. We see how the stratosphere has been rumbling since mid-January with attempts at a stratospheric warming event, but it is only as of the last few days that the stratosphere saw a massive warming event, titled a sudden stratospheric warming (SSW) event. To see how big this event is, let's head down to the 30 millibar level, located further down in the atmosphere compared to the 10mb level.

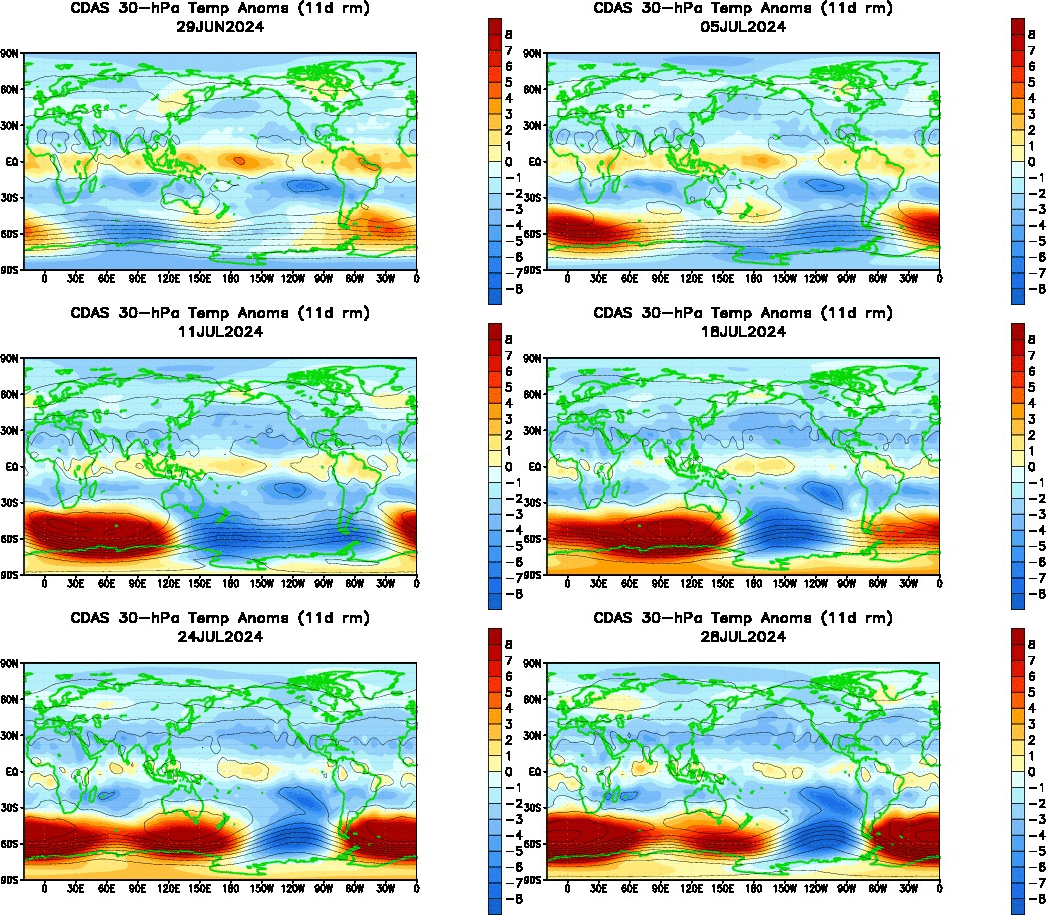
The 30mb temperature anomaly animation above shows how the stratospheric polar vortex has been under attack for a longer period of time compared to the upper stratosphere. We see a large swath of warmth had been developing and manifesting itself in Eurasia in January into February before finally bursting into the upper latitudes. It is now clear that the sudden stratospheric warming event has extended itself into a decent chunk of the stratosphere. Let's check up on the 50 millibar level next.

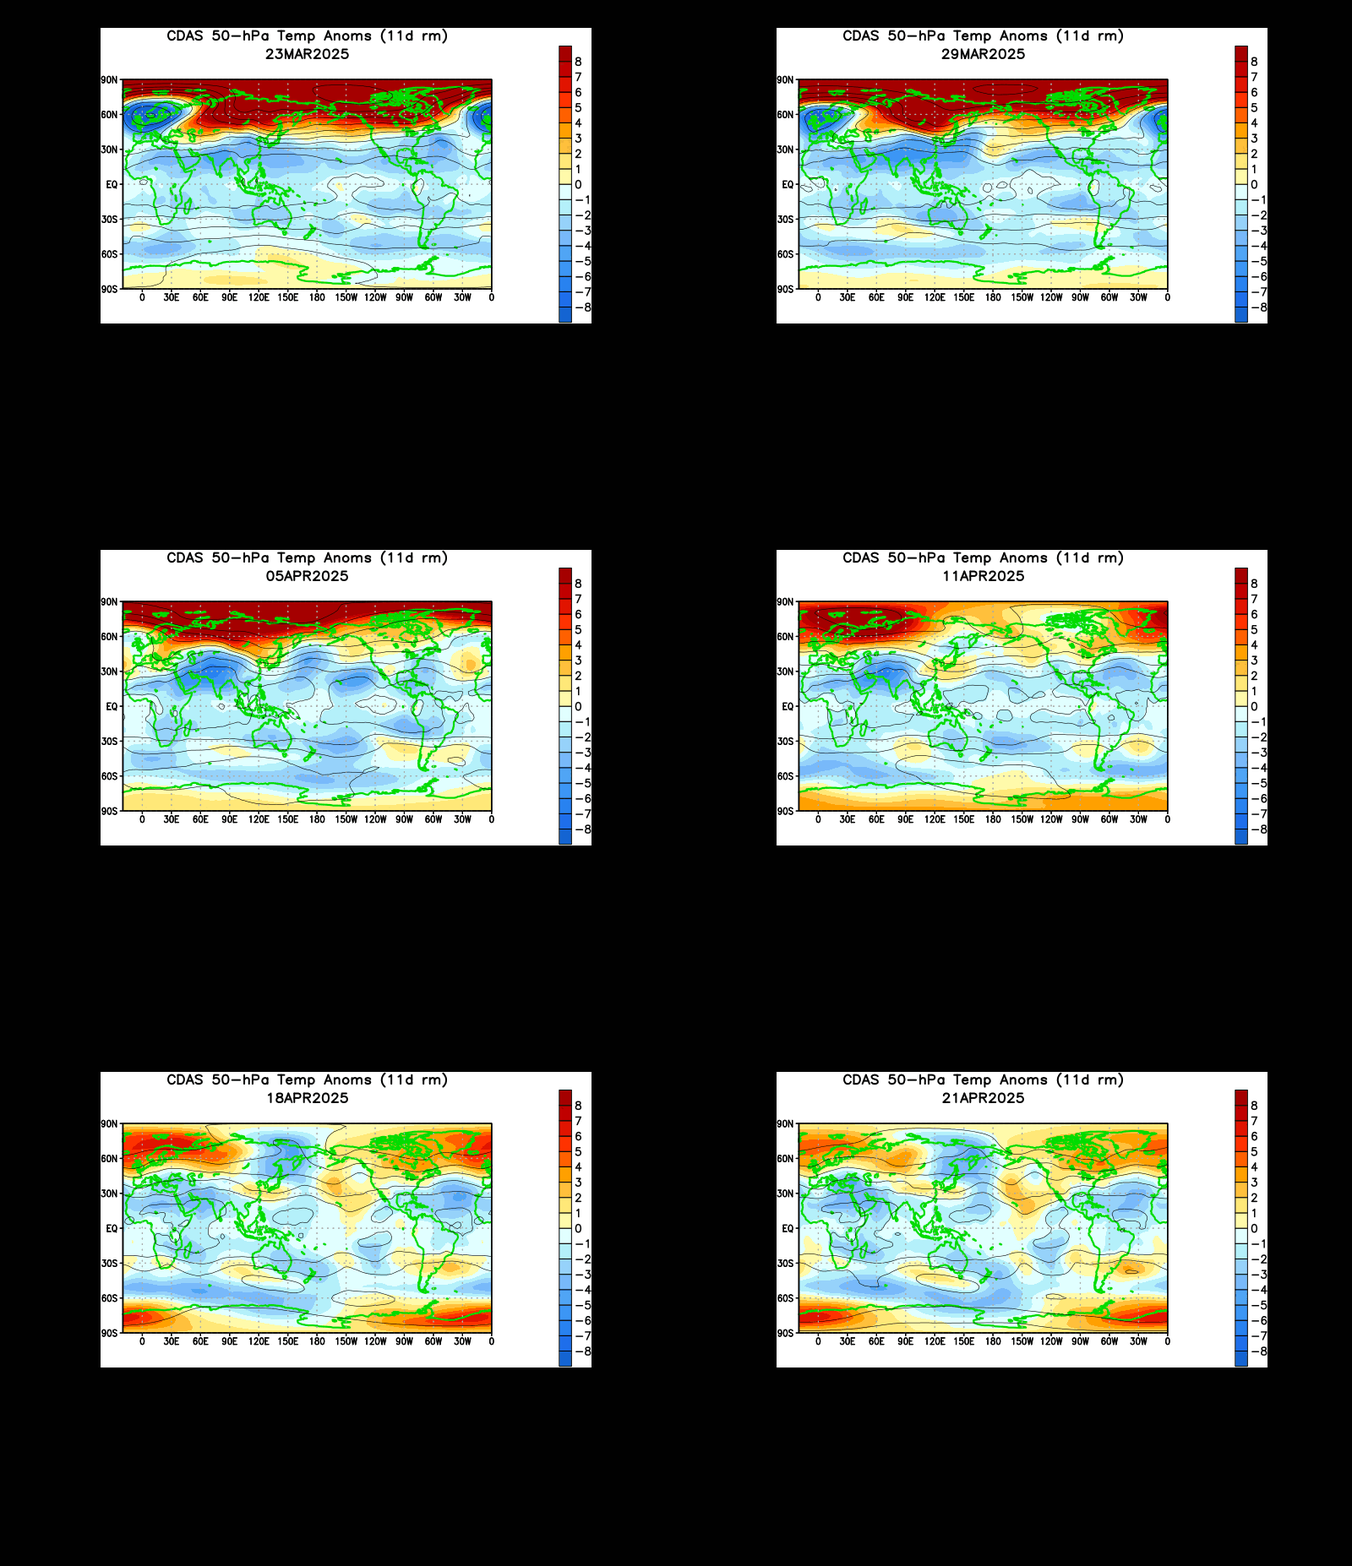
The 50mb level is also seeing significant warming in the upper latitudes, which only confirms the idea that this is indeed a sudden stratospheric warming event, quite possibly the first one we've seen this whole season.

Why is this a big deal? The sudden stratospheric warming phenomenon allows the polar vortex to weaken, and this enhances the possibility of Arctic cold outbreaks not unlike those we saw earlier in January. I'm not saying we will see January 2014-level cold again, the prospects of cold outbreaks rise roughly 2-4 weeks after the sudden stratospheric warming occurs. This would place cold weather prospects in the February 18-March 4th period. It's already looking like we'll see a cold blast to kick off March, and this could be related.

The ECMWF model sees this intrusion on the stratosphere continuing, forecasting continued elevated geopotential-Wave 1 activity at the 10 day forecast period. We see the elevated values maximized around the 3mb to 30mb levels, with lesser influences downwelling as low as the 500mb level. It is likely that this will be the biggest stratospheric intrusion this season, as we are just about to wrap up the meteorological winter season, and the "final warming" (where polar winds reverse to signal the end of the SSW season) isn't too far away.

Andrew

Friday, December 13, 2013

Long Range Lookout: Brutally Cold December Continues into January

New data I've compiled over the past few weeks leads me to believe that the end half of December and on into January will be filled with some pretty cold weather.

This data came as a result of analyzing the stratosphere, and determining the placement of temperature anomalies. Using a 2-4 week gap between warming and cooling air masses in the stratosphere, something I like to call the Stratospheric Temperature Index (STI) was created. 

For some verification, take a look at this text from a post I made on December 1st:


Between October 30 and the first few days of November, the Central and East US experienced above normal temperatures in the upper stratosphere. This is displayed well in the Climate Prediction Center's reanalysis of the 30th in the image above. These few days between the end of October and the start of November also included slightly above normal stratospheric temperatures diving south from Canada, with below normal temperatures observed in the Pacific Northwest. Because the effects of stratospheric warmings are typically seen 2-4 weeks after the warming event, we took a look at surface temperatures from November 14-28 to see how well the surface temperatures matched up with the upper stratospheric temperature anomalies (note that this is a negative correlation relationship, meaning above-normal stratospheric temperatures will lead to cold surface temperatures, and vice versa).
Ground-level temperature verification from November 14th to November 28th, approximately 2-4 weeks after the height of this US upper stratospheric warming event, is nearly identical to the temperature anomalies experienced in the stratosphere. The regions that saw above normal stratospheric temperatures, including the Central and East US, as well as Canada, saw below normal temperatures during this timeframe. Similarly, the Pacific Northwest, which was bathed in slightly below normal upper stratospheric temperatures to kick off November, was included in slightly above normal surface temperatures from November 14th to November 28th. It would seem to me that the stratosphere had a direct involvement with these surface temperature anomalies, given how well the stratospheric and surface temperature anomalies line up. (End Dec. 1 post.)

Get the gist? Above normal temperature anomalies tend to lead to below normal temperature anomalies, and vice versa. So now, let's take a look at what's happening here, with the most recent verification.


This image from the 10 millibar region in the stratosphere shows significant below normal temperature anomalies across much of Asia into the Northern Pacific, with above normal temperature anomalies stretching from the United States into Western Europe, with another swath of warm temperatures in East Asia on November 28th, 2013. Let's see how surface temperatures for December 7-10 are showing up, as the 2-4 week verification window from November 28th of December 14-28 is upon us.
It's no coincidence that we saw strong above normal temperatures across the North Pacific in response to those below normal stratospheric anomalies in late November. The warm stratosphere in the United States shows up as below normal temperature anomalies, fitting in to the STI's definition. Also, note how Western Europe shows up as below normal, and even a portion of East Asia getting in on the cold weather. Can you see how the index is verifying?

Now, take a look at this image of upper stratospheric temperature anomalies for December 7th. We see a strong body of above normal anomalies in the United States, as well as Central/Eastern Europe into East Asia. Significantly below normal anomalies are observed across Canada, the North Pacific and far northeast Asia. 

If we take that verification window from the late November warming (December 14-28), we can expect that timeframe to be colder than normal in the US. With the current warming intensifying in the image immediately above, we can now expect continued cold weather in the December 21-January 4. Depending on how long the warming in the United States lasts, we could continue to see cold weather well into January. It is tough to tell the intensity of the cold, but based on verification stats, it appears clear that the United States should see at least some cold weather.

Andrew

Tuesday, December 3, 2013

Risk for Severe Cold, Significant Winter Storms Rising for Mid-Late December

There could (keyword is COULD!) be an atmospheric pattern evolving that may be setting up for some severe cold weather and potentially significant winter storms for the latter half of December.

Long range hovmoller projections for the Outgoing Longwave Radiation (OLR) suggest that an MJO wave will begin moving towards the 180 degree longitude region, which will begin the process for this atmospheric pattern. The OLR works with blues and purples signifying negative OLR anomalies and enhanced convection, as well as yellows and reds portraying positive OLR anomalies and suppressed convection. The MJO wave has actually started its progression early from roughly the 90E longitude line, as the blues and purples indicate just above the black line towards the bottom of the image (that black line illustrates the line between observed OLR anomalies and forecast OLR anomalies, which appear above and below that line, respectively). It is expected that the wave will push from the Phase 2-ish region eastward, before weakening yet again, as the dashed black oval illustrates in between the two blue swaths in the bottom left of the graphic.

This graphic from the Australian Bureau of Meteorology (BOM) illustrates each MJO phase and its respective OLR anomaly. Just like the hovmoller above, blues show enhanced convection (active MJO phase) and yellows show suppressed convection. Taking a look at the graphic at the top of this post, we see the blue oval near the bottom of the image starting out at the 120E longitude line. A glance at the composite graphic above tells us this puts the MJO in Phase 5. The enhanced convection, outlined by that blue oval, is then predicted to continue travelling towards the 180 longitude line, which places the Madden-Julian Oscillation at Phases 6 and 7. We're going to switch topics, but will revisit this MJO topic a little later on in this post.

Take a look at this forecast from the ECMWF ensembles. To many of you, this is just a big ridge of high pressure, but it is actually much more. This ridge, as well as the ridging that has hit the Gulf of Alaska recently and will continue to do in the near future, is part of a Rossby Wave train that has set up over the Pacific. The Rossby Wave involves either a large high or low pressure system pushing up into the upper latitudes (in the case of an anticyclonic Rossby Wave) or pushing down towards the mid-latitudes (in the case of a cyclonic Rossby Wave).


The graphic above gives an example of a cyclonic Rossby Wave, and you can see that pronounced low pressure system dropping south, resulting in adjacent ridging in the jet stream. A similar situation happens with the anticyclonic jet stream- the high pressure system pushes up into the upper latitudes, and adjacent dips in the jet stream develop as the wave penetrates further into the upper latitudes.

Atmospheric Angular Momentum (AAM) tendencies confirm the emergence of the anticyclonic Rossby Wave in the mid-latitudes of the Pacific with a sharp increase (shown in oranges and reds) in the AAM tendency in the top right of the image, which is below the 60N parallel.
AAM tendencies
So now that we are pretty much expecting this anticyclonic Rossby Wave to develop in the Pacific, like it's been doing recently, the question goes to 'why will it shift west into Russia?' The answer - you guessed it- goes back to the MJO.

Take a look at this composite above, developed by Allan Huffman. This shows the mid-level geopotential height anomalies for the Northern Hemisphere during a December Phase 3 MJO. As I mentioned above, in the MJO discussion at the start of this post, we are expecting an emergence of the MJO into Phase 3 before the weakening occurs, and before the enhanced convection (think blue oval in the hovmoller) returns in Phase 5 later on. You'll notice deep negative height anomalies over the Bering Sea and Gulf of Alaska, and then ridging extending from the Pacific into far northeast Russia in this composite image. That ridging is expected to be the anticyclonic Rossby Wave train location when the MJO emerges into Phase 3. If you recall, in yesterday's post, I discussed how troughing in the Gulf of Alaska will lead to a positive East Pacific Oscillation (EPO) to develop. The Phase 3 MJO composite confirms this prospect, as the anticyclonic Rossby Wave being shoved west takes our current cold weather away and pushes it into the Gulf of Alaska.

When the MJO weakens again, the Rossby Waves should gradually shift east before they really get pushed east, and that's where the real fun begins.

Remember how we saw the blue oval enhanced convection returning in the hovmoller, roughly in mid-December, and we saw how that meant a Phase 5 MJO would develop? Well, here's the composite image for mid-level height anomalies for a December Phase 5 MJO wave. You can see the ridging in the Pacific, but now it's displaced in the Gulf of Alaska. Think about what that means. That means, if it can sustain itself, the anticyclonic Rossby Wave train will come back into the Gulf of Alaska, and give North America a real freeze, as those dips in the jet stream adjacent to each side of the ridge come back into play, like we discussed with the example of the cyclonic Rossby Wave image above.

The long range OLR forecast then tells us the MJO will progress into Phase 6, and look at what the December mid-level geopotential height composite for the Phase 6 MJO shows us. The ridging is now steadily fixated in the Gulf of Alaska, now knocking on the door of the West Coast of the United States. This would mean that the anticyclonic Rossby Wave train would also push east, resulting in the frigid weather produced by this ridging to shift east and impact not only the Plains, which up until this point would be receiving the main brunt of this icebox-like air mass, but also the Midwest, Great Lakes, Ohio Valley, all the way down to the Gulf Coast.

For what it's worth, the Phase 5 and 6 temperature composites for the MJO are very warm for the nation, but I can tell you now that such a warm US wouldn't verify if the Rossby Wave train did progress into Phases 5 and 6, and if the LRC works out well, as I'll discuss later on in this post.

As an added bonus, a 6-variable MJO projection created by Michael Ventrice (right panel below) confirms this whole evolution of the MJO, at least out until the 10th of December. It doesn't show the weakening of the MJO like other global MJO forecasts show (you can see them by going to our Weather Models page and scrolling down to the Teleconnections region), but still confirms the idea of the MJO progressing through Phase 3, and eventually making its way to the other phases as we get into the long range. I personally feel that the ECMWF MJO forecast (left panel) goes better with this current situation, especially when you look at the weakening of the OLR in the hovmoller at the top of this page and see the ECMWF weakening its forecast as well when it goes into Phase 4. However, both forecasts have their benefits, and at the end of the day, I've got a good feeling the MJO will progress through the phases we have covered thus far.

ECMWF MJO forecast (left) and Michael Ventrice's 6-variable MJO forecast (right).
So you've heard my reasoning behind why the second half of December could get extremely cold, but not the significant winter storms. What's the reasoning behind that?

Well, for one, as long as the Rossby Wave train sticks around in the Pacific, it will produce anomalously amplified waves of low pressure in those jet stream dips we've been discussing that appear on each side of the anticyclone. Thus, when those strong storm systems push out into the United States (or anywhere around the world), you've got the likelihood that the Rossby Wave will enhance the tendency for those storm systems to be significant in terms of potential effects, especially in the winter department.

Another impoartant factor will be the projected evolution of the MJO into Phase 5 and 6.

Check out the precipitation composites for a November-December-January MJO wave in Phases 5 and 6. There is a clear trend towards above normal precipitation in the Ohio Valley and Midwest, as well as the Great Lakes and a portion of the Northeast. That dryness you see in the Southeast is most likely a byproduct of the storminess around Greenland during Phase 5 and 6 MJO events in December, which produces a positive North Atlantic Oscillation (NAO). You weather junkies know that a +NAO then produces ridging in the Southeast and directs storm systems north into the Midwest, Ohio Valley and a part of New England. With the MJO projected to head into Phases 5 and 6 for the latter half of December, it does appear likely that the stormy trend we have been seeing recently for the Plains and Midwest will continue, should these MJO projections verify.

The Lezak Recurring Cycle also appears to be throwing its support behind a mid-late December colder trend. The Lezak Recurring Cycle, or LRC, is a tool developed by meteorologist Gary Lezak that, in essence, can enable forecasters to predict the overall weather pattern months in advance. The gist of the LRC involves a cycling weather pattern that develops in October and November of each year; no pattern is the same from year to year. Around mid November, the LRC begins to repeat, meaning we start to see a similar weather pattern in mid November that we saw in early October. This means that the cycling pattern has begun, and it will continue to cycle on a 40-60 day interval for the next ~10 months before it dissipates over the following summer. This season, we will have a cycle length of 57 days, meaning the weather pattern on October 19th should correlate similarly to the weather pattern on December 15th, 57 days later. Likewise, the October 22 weather pattern should come back around on December 18th. This time period has a deep depression in the jet stream, along with ridging in the West. If we combine the MJO projections with our knowledge of the MJO composites and potential location of the anticyclonic Rossby Wave train during Phases 5 and 6, and put that together with the LRC, it would seem that very cold period of weather is on the way after around December 15th, give or take a couple of days. This doesn't mean it will 100% verify, but the LRC is one factor I place high confidence in, and the MJO willing to transfer this potential anticyclonic Rossby Wave train into the Gulf of Alaska would mean that the cold wouldn't just be "cold"- it would be potentially brutal. In addition to the LRC seeing cold around the mid-late December timeframe, it also points out the presence of stormy conditions in the Plains, Midwest and Ohio Valley during this timeframe, adding credibility to the MJO Phase 5 and 6 precipitation composite.

In case you didn't get any of that, here's the summary.
-The Madden-Julian Oscillation is predicted to move into favorable phases for pushing a large, repetitive anticyclone east towards the US.
-The weather pattern then favors potentially brutal cold in the nation for the mid-late December period.
-Stormy conditions in the Midwest, Plains, Great Lakes, Ohio Valley, and Northeast are then possible.

The usual long range forecasting caveats apply in this case, including the chance that this may not happen at all. My confidence is decent that this should happen at least to some extent, but there's always something that could go wrong, thus the caveats of long range forecasting.

If you liked this post, don't forget to share it around the Internet- the more people reach this page, the more posts I want to write for this blog!

Andrew

Monday, December 2, 2013

December Looking Downright Frigid

Forecasts for a warm start to winter (mine included) are quickly being beat down with the emergence of new data in the long range. (Note, this post will deal with how December will average out to be frigid in parts of the country, not necessarily continuous cold weather.)

WeatherBell Models
European ensemble projections of 500 millibar geopotential height anomalies for the 10-12 day forecast timeframe have a strong ridge of high pressure evolving over the Bering Sea and beginning to shift westward. If true, this would lead to a couple of consequences.

First of all, it appears that a Rex Block might try to set up shop across eastern Russia and into East Asia. This forecast graphic above somewhat depicts that, with negative geopotential height anomalies forming across East Asia as that big ridge tries to progress west. At the same time as the ridge retrogrades west towards Russia, the persistent negative East Pacific Oscillation that has been prevailing across the Gulf of Alaska may actually reverse into a positive EPO, which would cut off our chances of this cold weather. This is to be anticipated, as the Bering Sea correlation of ridging on November 30th should result in some warmer weather in the US for a brief period, almost right in the middle of the month. Long range ensembles are already catching on to this idea, expanding the Southeast Ridge north, as the +EPO and +NAO aid in warm weather prospects. Beyond that, though, cold weather should return. Very long range ensembles indicate the ridge will shift east once again, which would kick out the +EPO and return the nation to a cooler pattern once again. 

The Madden Julian looks to lock in this warm-up in the middle of December, as it pushes into Phases 3 and 4 around December 8th through the 12th, roughly, as model guidance shows below.

November-December-January Phase 3 & 4 temperature composites on left
ECMWF MJO projection on right
After this mid-month warm up, the ridge should retrograde as the Phase 3 & 4 MJO dissipates. Interestingly enough, mid-level height composites for Phase 4 of the MJO in December actually favor deep negative height anomalies in the Gulf of Alaska, which would help push the ridge west towards Russia and enhance that positive East Pacific Oscillation chance. See how everything's interconnected here?

When the ridge retrogrades, expect the warm weather to dissipate and at least average, if not below average temperature anomalies spread out over the nation. If you take a look at that ECMWF ensemble guidance image at the top of this post again, you'll see that very stormy weather over East Asia like we previously discussed. With GFS ensembles in agreement, it does seem that the middle and latter portions of December will be rather stormy and cold in the United States as a result of that East Asian storminess. If you recall, weather in East Asia correlates with weather in the United States 6-10 days later. It's still a ways away, but if these stormy East Asian projections verify, I don't see why a resurgence of colder weather isn't possible. 

WeatherBell Models
Adding to this whole mix is the fact that the majority of what is referred to as the polar vortex will be over North America during this timeframe. As the ECMWF ensemble image above, valid for December 10th shows, two major ridges of high pressure will be stationed at key points across the upper latitudes. The aforementioned Bering Sea ridge will be meandering around the north Pacific, and another ridge in western Europe will be lending its hand to contain the polar vortex in North America. There is ridging in the Southeast, a result of deep negative height anomalies over Greenland (positive North Atlantic Oscillation), and this will keep the coldest weather in the West, Plains, and parts of the Midwest and Great Lakes for the most part. Intrusions further east are probable, but for consistent cold, the aforementioned regions are at the highest risk. 

The stratosphere may also try to play a role here, as I discussed in yesterday's post.

The stratosphere is telling us that the Central and East US may be in line for some very cold weather in the second half of December, and verification from its last cold weather indication says that we should be monitoring this development.

Between October 30 and the first few days of November, the Central and East US experienced above normal temperatures in the upper stratosphere. This is displayed well in the Climate Prediction Center's reanalysis of the 30th in the image above. These few days between the end of October and the start of November also included slightly above normal stratospheric temperatures diving south from Canada, with below normal temperatures observed in the Pacific Northwest. Because the effects of stratospheric warmings are typically seen 2-4 weeks after the warming event, we took a look at surface temperatures from November 14-28 to see how well the surface temperatures matched up with the upper stratospheric temperature anomalies (note that this is a negative correlation relationship, meaning above-normal stratospheric temperatures will lead to cold surface temperatures, and vice versa).

Ground-level temperature verification from November 14th to November 28th, approximately 2-4 weeks after the height of this US upper stratospheric warming event, is nearly identical to the temperature anomalies experienced in the stratosphere. The regions that saw above normal stratospheric temperatures, including the Central and East US, as well as Canada, saw below normal temperatures during this timeframe. Similarly, the Pacific Northwest, which was bathed in slightly below normal upper stratospheric temperatures to kick off November, was included in slightly above normal surface temperatures from November 14th to November 28th. It would seem to me that the stratosphere had a direct involvement with these surface temperature anomalies, given how well the stratospheric and surface temperature anomalies line up.

In the last few days, the upper stratosphere has suddenly sprang to life, with a wide swath of much above-normal temperature anomalies extending from as far west as the Rockies to the Eastern Seaboard, through the Atlantic Ocean and off to far western Europe. This would seem to hint at colder than normal weather making a return to the nation somewhere in the December 14-28 timeframe, roughly 2-4 weeks after yesterday (November 30th). Normally, I wouldn't be putting so much faith in the stratosphere to dictate temperatures for the next few weeks. However, with its stellar verification in the prior event, I'm willing to give this stronger warming event a shot. That said, I'm going along with this colder than normal prognosis for December 14-28 with low confidence, as there are a few other factors that may try and intervene to bring about warmer temperatures for this timeframe than what the stratosphere is suggesting. But until those come to fruition, I'll go ahead with the stratosphere's call for cooler temperatures between December 14th and 28th.

Let's summarize.
The beginning of December will be cold, as we have been anticipating for some time now. Around the middle of the month, a warm-up is expected, as the MJO, Bering Sea Rule and +EPO come into play. Then, as the MJO dies down, a colder weather pattern is expected to regain control as the East Asian correlation comes into play, the -EPO re-emerges, and any effects from the warming stratosphere propagate down to the surface. Averaged out, the month of December should end up very cold/frigid for many parts of the country.

Andrew

Sunday, December 1, 2013

Stratospheric Warming Events May Be Suppressed This Winter

Latest data suggests the probability for stratospheric warming events is relatively low for much of the winter. While they are not completely ruled out of possibility, the likelihood of them happening is reduced.

One culprit of this suppression of sudden stratospheric warming events (SSW events) is the below-normal state of the 100 millibar poleward eddy heat flux. To summarize, the poleward eddy heat flux, when above normal, helps initiate SSW events and helps to weaken the polar vortex by enhancing these attempts to push warm air into the stratosphere to kick off those SSWs. Below normal heat flux values suggest a stronger polar vortex, as the willingness of the stratosphere to kickstart SSW events is lower than normal. We have seen a rise in the lower stratosphere eddy heat flux values, but I doubt we will be seeing significant warming events in the stratosphere until this factor, among others, complies.

Keeping with the observed conditions in the stratosphere, temperature data across the entirety of the stratosphere indicates temperatures are well below normal. While this chart for 50 millibars (commonly identified as the middle of the stratosphere) tells the story of a colder than normal stratosphere, you could look at any level of the stratosphere from the 1 millibar level (the top of the stratosphere) to the 70 millibar level (one of the lower regions of the stratosphere) and find the same result, which says the stratosphere is colder than normal. This really isn't good news for those wanting some stratospheric activity. It's one thing for one region of the stratosphere to be colder than normal, but it's a whole different matter when the entire stratosphere is colder than normal. If a specific region is colder than normal, it isn't a gigantic block to SSW chances. But with the entirety of the stratosphere colder than normal, the chances of warming events are significantly diminished. Add to that the below-normal eddy heat flux values and the final factor we will discuss below, and the stratosphere really isn't looking so hot, both literally and figuratively.

To add to all the troubles the stratosphere is having, the Quasi-Biennial Oscillation (QBO), a wind-related oscillation entrenched in the stratosphere, is doing nothing to help matters. The QBO switches between positive/westerly and negative/easterly phases, where the positive QBO strengthens the polar vortex and the negative QBO weakens it. The Quasi-Biennial Oscillation had previously been in a deep negative trend, as shown by the solid negative phases and significantly weakened positive phases over the past few years. Now, the new positive QBO is breaking through that barrier and is at levels not seen for several years. To summarize, this positive QBO is bad for stratospheric warming prospects, especially now that the +QBO continues to strengthen.

Michael Ventrice has been able to divide the QBO into eight phases, not unlike the Madden-Julian Oscillation. Each phase has its own mid-level (500 millibar) height anomaly distinction, as Mr. Ventrice's composite chart for December-January-February shows below.

As you can see, Phase 6 of the QBO (which we are currently in) promotes significantly below-normal height anomalies across the Arctic Circle, leading to ridging over the Southeast and East Coast, in addition to ridging over the Gulf of Alaska. This has been displayed well in the recent weather pattern, and medium-range forecasts show no end to the Phase 6 QBO. We are all looking forward to when (or if) the QBO enters Phase 7, which is projected to happen later on this winter. When the QBO shifts to phase 7, the composite chart tells us that high pressure will dominate the upper latitudes, leading to a favorable winter pattern over the Central and Eastern US. Now, this does not mean that the weather pattern will always be high pressure over the Arctic and cold in the Lower 48. But it does mean that those conditions become more possible/probable with the emergence of that Phase 7 QBO. However, until that Phase 7 evolves, we're really out of luck in the stratosphere, as the unfavorable QBO, anomalously weak eddy flux values and colder than normal stratosphere temperatures combine to create a trifecta of unfavorable SSW conditions.

Andrew

ALSO: ICYMI:
-December 2-4 Potential Blizzard
-December 5-7 Potential Winter Storm
-December 8-9 Potential Southeast Snowstorm/Ice Storm

Data in this post was contributed by Eric Webb.