Today, we'll be addressing the idea on if the next 'Super El Nino' could be forming in coming months. But first, let's revisit the concept of an El Nino.
The image above shows sea level anomalies associated with the El Nino phase of the El Nino-Southern Oscillation (ENSO) phenomenon, as well as the La Nina phase. As is shown, an El Nino sees substantially higher than normal sea levels in the eastern Equatorial Pacific, while a La Nina sees below normal sea level anomalies. In the same sense, an El Nino observes warmer than normal waters over those same areas, and a La Nina depicts colder than normal waters in the same blue and purple areas shown.
Now that we've established the ENSO phenomenon, let's move on to the original 'Super El Nino' of 1997.
Beginning in the summer of 1997, we began to see rapid and extreme warming of the eastern Equatorial Pacific, defined hereafter as the Pacific waters along the equator east of the 180 degree longitude line. The above image, created by the NCEP/NCAR Reanalysis system, shows anomalous sea surface temperature anomalies in Celsius from November 1st, 1997 to December 31st, 1997 at the height of the El Nino event. We saw anomalies top 4 degrees Celsius above normal, as the contour line shows, indicative of a truly historic El Nino event. We also began to see a shift in the sea surface temperature pattern in the Northeast Pacific, as cooler than normal waters began to push northeast, making for a typical positive Pacific Decadal Oscillation (PDO) phase.

If we look at Oceanic Nino Index (ONI) values over the 1997 period, we see how the El Nino-Southern Oscillation (ENSO) began in a cool-neutral phase, where we see water temperatures that are cooler than normal, but not cool enough to be classified as a La Nina. This cool-neutral state rapidly eroded as we moved into March-April-May 1997, as we saw ONI values rise a handful of decimal places each month, before an official El Nino was declared in May 1997, as the ONI rose to +0.7 degrees Celsius, above the +0.5 degree threshold that defines an El Nino. From there, eastern Equatorial sea surface temperatures continued to rise at an alarming rate, as we entered Moderate El Nino territory in June 1997 with the emergence of sea surface temperature anomalies (SSTAs) above +1.0 degrees Celsius. Just one month later, in July 1997, a Strong El Nino event was declared, as SSTAs hit the +1.5 degree Celsius benchmark that defines a strong El Nino. It didn't stop there, however; the ONI continued to skyrocket until November 1997, when we hit the peak of the El Nino event with an ONI value of +2.4º Celsius, a record-breaking value up to that point in recorded history. Now, with climate models suggesting we're about to enter into a new El Nino, and new data indicating a strong El Nino is becoming increasingly likely, it's time to consider if we are about to dive headfirst into the next Super El Nino.

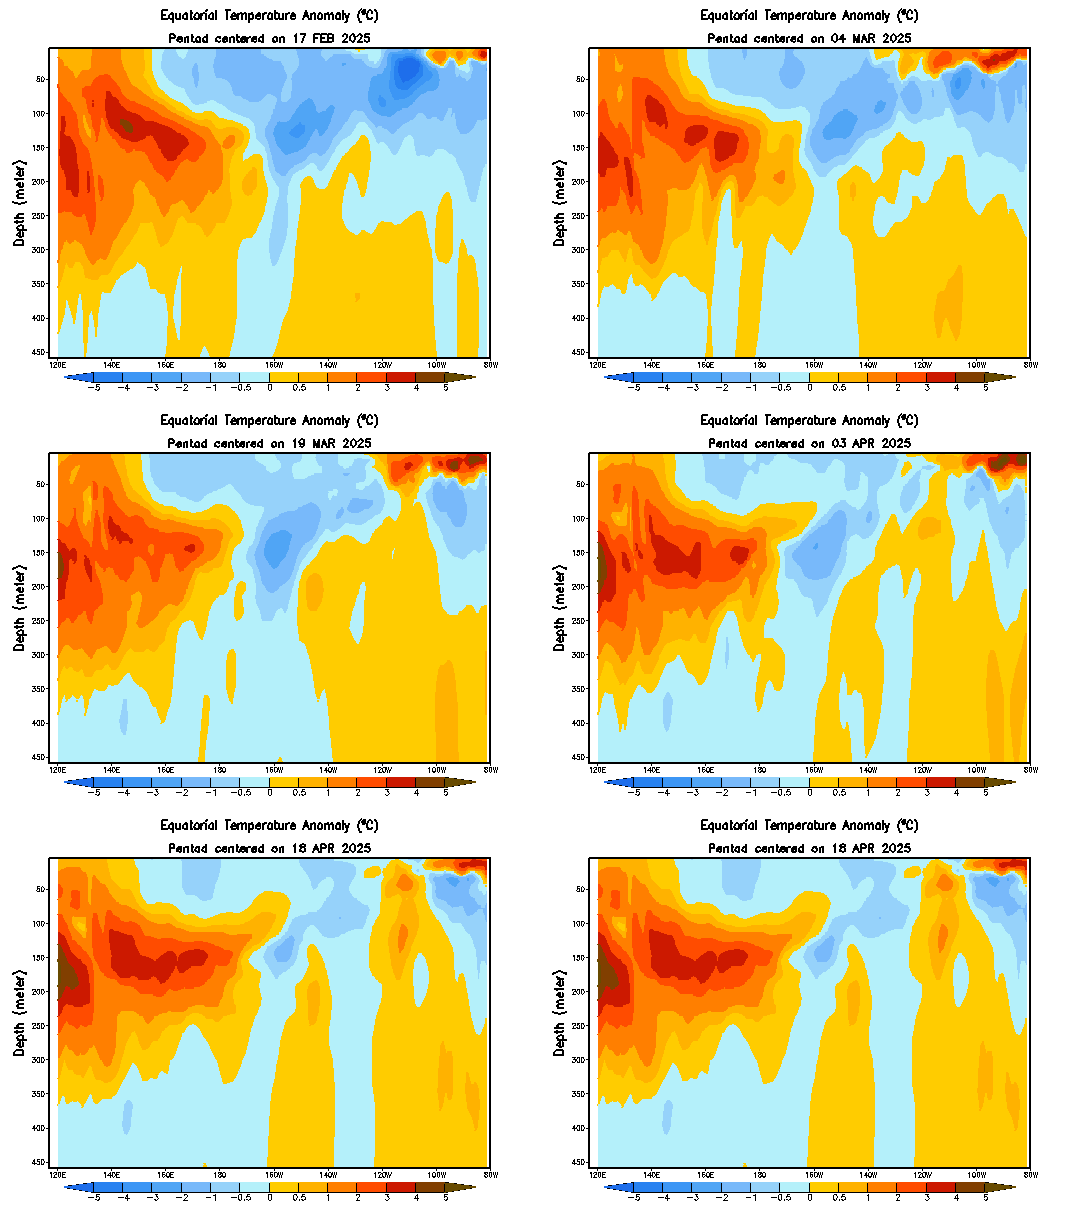
Let's begin by taking a look at sea surface temperatures and anomalies under the surface for the month of March. The graphic above shows three panels; the top panel shows the typical climatology of sea surface temperatures for the month of March, while the middle panel shows observed SSTs (not SSTAs, those would be anomalies; the second panel just shows the real observed temperatures in Celsius). What we want to pay attention to is the bottom panel, where we can see sea surface temperature anomalies in the Eastern Equatorial Pacific down to as low as 400 meters below the surface. What we see is startling- there is a massive body of warmer than normal water located 100 to 200 meters below the surface. An animation of subsurface anomalies confirms that not only do we have a historically strong warm body of water below the surface, but it's actually moving towards the surface.
This swath of warm water tells us that there is a Kelvin Wave afoot.
This graphic, drawn up by Mike Ventrice, shows the sort of situation we're experiencing with the Kelvin Wave. As the Kelvin Wave pushes east, we see sea level anomalies rise in conjunction with the anomalous warmth. Ahead of the Kelvin Wave, we then see downwelling, which lowers sea levels and cools sea surface temperatures, leading to a 'false Nina', where the SSTAs might tell us there's a La Nina, but it's actually just a byproduct of the Kelvin Wave beginning to push east.

The image here shows the anomalous depth of the 20 degree Celsius isotherm from the present until April 2013, about one year ago. This is a tool forecasters can use to determine what ENSO state we are in, or if there is a Kelvin Wave occurring. If we look at the anomalies since spring of 2013, we don't really see any anomalies present until July 2013, when we saw a weak Kelvin Wave push through. The cool-neutral ENSO state we were in is apparent by the slightly cooler than normal waters from April to July, but the whole scene changes in July. We saw two weak Kelvin Waves push through, as the two lines of warmer than normal waters show from July to October 2013. We then saw that sort of downwelling event prior to the next Kelvin Wave, with cooler than normal waters coming around in October 2013 before the next, stronger Kelvin Wave moved across the Pacific. Then, recently, as we moved into January 2014, we saw the strongest downwelling event in recent history, close to an actual La Nina, before this Kelvin Wave made itself known. As you can see in the image, this Kelvin Wave is the strongest one not only in this image, but even stronger than the Kelvin Wave that produced the 1997-1998 Super El Nino.

The image above shows the same three panels we discussed a few images ago, but now valid in March 1997. If we take a look at subsurface temperature anomalies, once again we see a very strong Kelvin Wave present 100 to 200 meters below the surface. This wave registered in at +4.3 degrees Celsius above normal, which doesn't even come close to the +5.4 degree Celsius anomaly we are currently observing, as the 2014 version of this three-panel image we analyzed earlier showed. Just based solely on the Kelvin Wave comparison, things are looking very supportive of a Super El Nino, or at least a general El Nino arising later on this year.
Something else we can use to analyze the state of the El Nino-Southern Oscillation (ENSO) phenomenon is the presence of anomalous lower level zonal winds across the Equatorial Pacific.

The image above shows past 850mb zonal wind anomalies from 5N to 5S on the latitude spectrum, covering the world on the longitude spectrum. What we're looking for in this image is the swath of above normal zonal winds between the 120E and 180 longitude demarcations, between February 17th and March 9th. During this timeframe, we observed anomalous westerly winds originating from the Indian Ocean and points just east, near Micronesia. These westerly winds are known better as westerly wind bursts (WWB), and are created when winds from low pressure systems north of the equator and winds from low pressure systems south of the equator combine to produce strong, eastward winds. These anomalous eastward winds herald the presence of an El Nino environment, as they assist in Kelvin Wave propagation, which then provokes an El Nino in some cases.

For a better explanation, take a look at the image I made above, illustrating the phenomenon. Low pressure systems have winds spinning counterclockwise, while low pressure systems south of the equator see winds spin clockwise. Near the equator, these winds can combine to make for strong westerly winds, which then show up on the time/longitude diagram we just analyzed as anomalous positive zonal wind values.

The image above shows a GFS forecast of 1000mb standard height anomalies with contours superimposed. If we look closely here, we see as many as four storm systems of concern. We see two compact, strong cyclones riding the 10S latitude line, one being northwest of Australia and the other northeast of the country. The third cyclone appears at the very top of the image, close to the 10N latitude line, north of the equator. There is also a fourth, stronger cyclone along the 10S line far to the east of Australia. What do all these storms mean? We can apply the diagram I drew up above this GFS forecast to this situation. The two cyclones immediately north of Australia and the cyclone at the top of the image have the potential to combine and make for another westerly wind burst (WWB), which would show up on diagrams as another swath of positive zonal wind anomalies. This forecast is valid for March 18th, and the hovmoller diagram (also known as the time/longitude diagram we analyzed two graphics above) supports this idea of another WWB event, showing westerly winds now centered at the 180 longitude line, a bit to the east of the previous WWB events in February. This eastward progression of the WWB events indicates even more support for an El Nino, and continuation of support for the Kelvin Wave currently sitting 100 to 200 meters below the surface.

The GFS only shows the westerly winds intensifying by March 22nd, with two very strong cyclones now present in the vicinity of Australia, and a strong cyclone still in place in the very top left corner of the image. This continues to tell me we're in for a pro-El Nino environment for the first time in several years.
Long range model guidance from Kyle MacRitchie indicate we will see negative outgoing longwave radiation (OLR, negative OLR values mean stormy weather) values continue to originate from the Indian Ocean region in the near future, only continuing to provoke WWB events and enhance the likelihood of not only an El Nino, but a strong El Nino/Super El Nino.
This graphic, showing OLR and 850mb wind forecasts for April 17, 2014 details how this pro-El Nino pattern is likely to continue into Spring, as we see negative OLR values continuing to push east, and westerly winds also continuing to push east, as is noted by the eastward pointing arrows.
The May forecast for these same variables shows even stronger negative OLR values in the Oceania region, with even stronger westerly 850mb winds. To me, this all spells a rapidly-forming El Nino, possibly coming about as quickly as May or June. That big Kelvin Wave just a hundred meters under the surface is pushing towards the surface, and if it does hit the surface before May, chances are great that we will see not only an El Nino form for the rest of this year, but it would likely be strong... as strong as a Super El Nino, potentially.
Even eerier than how strong this Kelvin Wave is, and how much the environment seems to be supporting at least a general El Nino (not to mention a Super El Nino), is how similar the westerly wind pattern in January-February-March 1997 is to the January-February-March pattern of 2014 (this year).
Shown above is an anomaly chart of 850mb zonal winds from January 1st, 2014 to March 1st, 2014. We see a swath of positive zonal winds in the vicinity of Malaysia and areas just north of Australia, proving the idea of those westerly wind burst events. We also see a large swath of westerly winds across the northern Pacific and Atlantic, even down to the far southern Pacific near Antarctica. General negative zonal wind anomalies are observed in the Eastern Equatorial Pacific, as the atmosphere is not under an El Nino
yet, and these negative anomalies extend into the Atlantic as well. Let's see how January-February-March 1997 matches up.
The comparison of 850mb zonal wind anomalies between January 1, 2014 to March 1, 2014 and January 1, 1997 to March 1, 1997 is stunning. Every single factor we outlined in the 2014 image above is present again in this 1997 image. We once again see the north Pacific strong westerly winds, the Atlantic westerly winds, the Oceania westerly winds, and even the long swath of anomalously high zonal winds in the southern Pacific near Antarctica. But it doesn't stop there- we see an almost perfectly-replicated placement of negative zonal wind anomalies in the Eastern Equatorial Pacific to the Atlantic. The environment today is extremely similar to the one in 1997. This only adds further to the increasing pile of evidence supporting not just an El Nino, but possibly a Super El Nino down the road.
So, what's causing all of this 'westerly wind' stuff, anyway? Is it just happening? The answer lies in yet another piece to this very intricate puzzle: the Madden-Julian Oscillation (MJO).
The image shown above was produced by Michael Ventrice, and shows a special view of the Madden-Julian Oscillation. For those unfamiliar with the concept, the Madden-Julian Oscillation involves the specific placement of enhanced or suppressed tropical convection along the equator. If the convection is enhanced in a certain area, it is put into a certain phase. In this instance, the MJO begins in Phase 1 with tropical convection enhanced just west of the subcontinent of India, and goes all the way out to Phase 8, which sees tropical convection placed far northeast of Australia, as the diagram below shows.
 |
A phase by phase breakdown of each phase of the MJO, where blues indicate enhanced tropical convection,
and oranges show suppressed tropical convection. |
Back to the phase space chart drawn up by Michael Ventrice, it is a specific graph. This MJO graph takes into account the El Nino Southern Oscillation phenomenon, which can produce its own enhanced or suppressed tropical convection, depending on which state (El Nino or La Nina) it is in. Additionally, the MJO is calculated based on 850mb zonal wind anomalies and their specific placement. In this case, you can switch out the negative OLR anomalies on the 8-panel graphic above for above normal zonal wind anomalies and you'll see a pretty good display of how the MJO can be calculated in that aspect. Now, the phase space shows the MJO back to December of 2013. Since then, we've seen an oscillation throughout all of the phases, but it's only been recently that we've seen a spike in MJO intensity, namely around Phases 7, 8, 1 and 2. These phases see enhanced tropical convection placed in and east of the Indian Ocean. This has led to multiple cyclones forming on either side of the equator, leading to, yes, the westerly wind burst phenomena. This forecast shows the MJO wanting to stay in the Phase 7, 8, 1 and 2 area, which would continue to form cyclones on either side of the equator to provoke additional WWB events, leading to a stronger pro-El Nino environment.
Now that we've well established that the atmosphere is really pushing for an El Nino, historically, how likely is an El Nino at this point?
 |
| Do not use without permission |
I made a chart above showing a compilation of Oceanic Nino Index (ONI) values of a given year that began in either a La Nina state (values below -0.5º Celsius) or a Cool-Neutral ENSO state (values between 0.0º C to -0.5º C) that then turned into El Nino years down the road. The dashed line shows the latest forecast, using the NCEP CFS long range model. As you can see, most years shown here had a rather linear ENSO growth from Nina to Nino state. The general cross-over to El Nino territory was observed around April to May, with moderate to strong El Nino events usually becoming known around June or July. To be honest, based on the data presented here, this would not surprise me to see the dashed line forecast verify, or even be stronger than what it is shown to be.
 |
| Do not use without permission |
I then created a graph showing La Nina or Cool-Neutral ENSO years that eventually became Strong El Nino (+1.5º Celsius anomaly or higher) years. Once again, we see a rather linear evolution of the El Nino, breaking into weak El Nino territory (+0.5º C to +1.0º C) around May of the given year, before hitting Strong El Nino territory around August or September of the year. Once again, the forecasted values are shown on the dashed line. I'm also thinking bullish on this forecast, in that we may see the El Nino stronger than what the dashed line forecast shows here. Regardless, the trend is clear- we are likely diving headfirst into an El Nino, if not a Strong/Super El Nino.
Based on all the data presented here, I feel we are well on our way to an El Nino. As for the question of if we break into Super El Nino territory, I'm definitely leaving it on the table, and I think it's a very real possibility. However, we will probably need another month or so to see just how great the chance of that is.
Andrew