Showing posts with label North Atlantic Oscillation (NAO). Show all posts

Thursday, December 9, 2021

Long-Range ECMWF ENS Control Member Shows Frigid January; Will it Verify?

 The latest long-range ensembles from the European forecasting agency came in the other day, and while on the whole they produced a generally milder outlook, we did see a surprise forecast from the 'control' member of these ensembles - a remarkably frigid January.

Before we get into the good stuff, let's review what that means.

The ECMWF agency is known for their namesake weather model, but they also provide a critical forecasting tool with their ensemble system. In an ensemble forecast, an initial forecast model is taken, tweaked ever so slightly, and then re-ran. That's one ensemble 'member'. Then, they take that initial data again, tweak it ever so slightly in a different way, and re-run it again. That's another ensemble member, and it continues. The ECMWF's ensemble system has 51 different members - they are all different versions of the ECMWF weather model, but each one has slightly different starting conditions in order to produce a different forecast. 

You might ask why one would do that, since it sounds a lot like all we're doing is intentionally changing the initial conditions and letting it run free. That doesn't sound very productive, does it? In reality, the value comes from how similar all of these 51 members are at each point in time. For example, if all 51 ensemble members showed a winter storm in the Midwest ten days from today, that would be a big boost to forecast confidence. Why? Because if all 51 members have that storm happening, it means no matter what the weather conditions are right now (i.e. even if they're tweaked in all kinds of ways), we still end up with a winter storm on the horizon. As a result, ensemble forecasting is a potent part of any forecaster's toolbox.

But each ensemble set - whether it's the ECMWF ensembles, the American (GFS) ensembles, or any other set - has one member that is different from the rest. This member's initial conditions are the best possible data we have, and all the other members are those slightly-tweaked versions of this one. We call this special ensemble member the control. Indeed, the control member is the raw forecast taken strictly using initial data. Nothing is tweaked, nothing is altered, just the raw initial conditions. Every other ensemble member takes that control member data, tweaks it a bit, and re-runs it, like I described above. 

One may argue that this makes the control member more attention-worthy, since it only uses the best initial conditions data we have and isn't artificially tweaked. Whether that argument has merit is something I have yet to verify on my own.


In any event, now that we understand why an ensemble's 'control' member is worth monitoring, let's get down to the good stuff: the reason why this post was made.


Attached above from WeatherBell (all images on this post are from WeatherBell) is a look at the seven-day average temperature anomaly from the ECMWF ensemble control member over the December 25th - January 1st timeframe. We see that the control member anticipates a deep and formidable reservoir of below-normal temperatures in western Canada, which begins bleeding south and east into the United States as December turns to January. Indeed, seven-day average anomalies of more than 25 degrees Fahrenheit below normal are nothing to shake a stick at!

The outlook continues into mid-January below:


From January 11th - 18th, temperatures are shown by the ECMWF ensemble control member to be much colder than normal across almost all of the country, particularly east of the Front Range and especially in the Ohio Valley. With seven-day average temperatures seen at almost 20 degrees F below normal in parts of Ohio, Indiana and Kentucky, it's clear that the ECMWF Control member expects the Arctic gates to burst open in the first month of the new year.

Teleconnections accordingly show a breakdown in the tropospheric polar vortex as judged by a collapse in the Arctic Oscillation in the blue line (control member's forecast)...


... and a similar plunge in the North Atlantic Oscillation (NAO) from the control member allows that frigid Canadian cold to plow eastwards...


Now, that's all good and fun to look at, but this post wasn't written to get all the cold weather fans out there hyped up. Indeed, as the above two teleconnection charts show, the control member is an extreme outlier in the late-December and early-January period, and the average of all ensemble members just barely turns the NAO negative at the end of this month. The mean doesn't even turn negative at all for the Arctic Oscillation!

My takeaway is this: we're seeing some noteworthy cold signals for the end of December and start of January from the ECMWF control and the CFS ensemble system (a different analysis of that coming later today), but we can't rely on models that far out. To me, it's just not smart forecasting to use them for anything aside from large grains of salt, if that makes sense. Instead, I'm focusing on a changing global weather regime as the Madden-Julian Oscillation changes into colder phases for the end of December and through January. That, I feel, is where the real intrigue lies for Arctic outbreak risks as we enter the new year.

Stay tuned for that aforementioned post later today.

To Summarize:

  • The ECMWF ensemble's 'control' member - often seen as the most accurate member of the ensemble group - is expecting much-below-normal temperatures from the end of December through much of January in the U.S.
  • At this stage, while it's intriguing, I would not take this signal as anything more than a large grain of salt
  • There is more value in monitoring the changing global pattern as the new year kicks off, and a post discussing that will be published a little later today.

Andrew

Sunday, June 9, 2019

Long Range Outlook (Made June 9, 2019)

This is a Long Range Outlook made for publication on June 9th. The forecast period will cover the remainder of June. Click on any image to enlarge it.

Observed 500-millibar geopotential height anomalies as of 1pm Central, June 8th.
Source: Tropical Tidbits
A look around the Northern Hemisphere on the afternoon of June 8th shows a rather-busy pattern over North America, with an upper level low positioned over northwest Canada and a secondary trough dropping into the Pacific Northwest while still being influenced by the first system. A strong ridge maximized over the northern Great Lakes into southern Canada contrasts with a closed low positioned in the Southeast U.S., forming a Rex Block-looking pattern despite there not being any actual blocking event taking place. Indeed, even downstream of this pattern into Newfoundland, the flow is rather amplified with an upper level low grinding against a strong ridge that is firmly entrenched into Greenland. Upstream of the United States, weak ridging is evident in the northeast Pacific, helping to diffuse the Pacific jet stream in the process. A strong storm system is seen south of the Aleutian Islands, with additional disturbed weather skirting along the northern Pacific.

Forecasted 500-millibar geopotential height anomalies valid 7am Central, June 12th.
Source: Tropical Tidbits
Even within the five-day forecast window, the evolution of the flow over the Northern Hemisphere becomes rather complex rather quickly. The ridge and closed low mentioned in the eastern half of North America are seen drifting eastward, with model guidance suggesting the ridge will propagate northeastward into Greenland to maximize positive 500mb height anomalies. Additionally, the observed weak ridging in the northeast Pacific is expected to strengthen and entrench itself across the western coast of the continent, thereby setting up a pattern representative of the positive phase of the Pacific-North American (PNA) oscillation, seen by ridging along the West Coast, as well as the negative phase of the North Atlantic Oscillation (NAO), seen by ridging over Greenland.

The result of these two features, as well as a messy picture for the West Pacific Oscillation and East Pacific Oscillation (EPO), is a likelihood of cooler than normal temperatures across the eastern two-thirds of the United States, as well as into Canada. The positive PNA and negative NAO will act to direct air from northern Canada down into the United States. Indeed, the five-day average 2-meters-above-the-surface temperature anomalies below, through the period ending June 14th, shows a substantial and widespread period of below-normal temperatures for the majority of the country.

Forecasted 5-day average ~surface temperature anomalies, valid through the period ending 1pm June 14th.
Source: Tropical Tidbits
Model guidance is showing strong confidence in the evolution of strong ridging over both western North America and Greenland as well:

NCEP Relative Measure of Predictability for 500-millibar values at forecast hour 96 (June 11th 7pm).
Source: NCEP
Given the high confidence in the projected pattern through the five-day forecast timeframe, it does appear that colder-than-normal temperatures are likely for the eastern two-thirds of the country through at least June 14th.

Forecasted 500-millibar geopotential height anomalies valid 7am Central, June 18th.
Source: Tropical Tidbits
Ensemble model guidance is in agreement that the strong ridge over Greenland (again, the negative-NAO pattern) will remain in place through at least the day 10 forecast period, as shown above by the ECMWF (European model) ensembles. Upstream of the contiguous United States, too, model guidance does not anticipate any significant changes in the aggregate pattern, with predictions of ridging continuing along the west coast of North America as an upper level low situates itself just south of Alaska.

Let's now turn to teleconnections and oscillations to ascertain if model guidance is correct in depicting the forecast into the end of June.

Forecasted states of the Pacific-North American (PNA) index, top-left; North Atlantic Oscillation (NAO), top-right; Western Pacific Oscillation (WPO), bottom-left; and the Eastern Pacific Oscillation (EPO), bottom-right.
Source: Earth System Research Laboratory (ESRL)
Viewing model-forecasted teleconnections over the next two weeks or so, we find a broad pattern similar to what was described earlier, with the positive PNA and negative NAO expected to dominate the outlook for North American weather throughout the forecast period. Guidance does weaken the PNA significantly from a strong-positive state to a slight-negative state by June 20th. I personally don't see this as remarkably likely when compared to a forecast that has the PNA remaining positive (even if modestly so) through the period, and I'll discuss why shortly.

As noted earlier, the WPO and EPO are not expected to be strong enough to materially disrupt the +PNA/-NAO combination, with the moderately-positive West Pacific Oscillation forecast actually a boon for helping to sustain the ridge along the western coast of North America, and thereby sustain the +PNA. Model guidance sees the EPO as hovering essentially around levels too weak to have a definitive impact on the weather pattern.

I'd like to briefly discuss a second reason - in addition to the expected positive WPO - why I believe the ridge along the western coast of North America (the +PNA) will sustain longer than guidance indicates here.
Madden-Julian Oscillation (MJO) phase space diagram forecast, from the ECMWF model.
Source: Climate Prediction Center and ensembles.

For a refresher on the concept of the Madden-Julian Oscillation and how to dissect a phase-space diagram, feel free to read this post from earlier. The European model and its ensembles anticipate the MJO staying in a low-grade Phase 3 state over the short-term, before shifting into Phase 4, strengthening somewhat, and then potentially weakening into the 'circle of death'. Given how model guidance in that linked post had expected us to be in the 'circle of death' at the time of this writing, rather than in Phase 3, we will only trust the forecast to take us from a low-grade Phase 3 to a low-grade Phase 4 through the end of June.

We are able to see how the atmosphere typically acts when the MJO is in Phase 4 for the month of June below.
500-millibar geopotential height anomalies when the MJO is in Phase 4 during the month of June.
Source: American Weather
When the MJO is in Phase 4 during the month of June, positive height anomalies tend to be favored over the Gulf of Alaska into parts of the Aleutian Islands, with another area of positive height anomalies over Greenland. Below-normal anomalies are then painted across a good swath of the eastern two-thirds of North America.

If you're thinking that this Phase 4 composite above looks remarkably similar to the forecasted pattern beginning around June 11th, as discussed earlier in this post, you aren't the only one. It doesn't seem coincidental to me that model guidance maintains the +PNA/-NAO pattern through much of the remainder of June, particularly since the MJO moving into Phase 4 would support exactly this kind of pattern to continue.
It is possible that guidance thinks the PNA will weaken and even reverse into a negative state by late June simply because the models are - correctly - trained to forecast the state of a teleconnection by comparing the forecasted pattern with a "textbook" pattern. For example, scientists have developed what the atmosphere should look like when the PNA is said to be positive, and thus models compare their forecast to that "ideal" pattern to determine what state the PNA will be in. However, the atmosphere is not binary like that - in other words, even though the PNA might be forecasted to be negative, the pattern itself may still resemble a positive PNA. Let's discuss this further.

Forecasted 500-millibar geopotential height anomalies valid 7am Central, June 21st, with annotations.
Source of image: Tropical Tidbits
Source of annotations: Author
Shown above is the 500-millibar height anomaly forecast from the GFS Ensembles, valid the morning of June 21st. This is the purported date by which the PNA is forecasted to turn negative, as per the four-panel graphic examined earlier in this article. Looking at the broad forecasted pattern, however, shows the pitfalls that simply taking the index forecast & going with it can present.

First, we recognize why guidance thinks the PNA will flip from strong-positive to a negative state: there is an expectation that troughing will develop along and off the coast of western North America, a part of which I have circled in red. To be sure, stormy activity in this region is indeed what a negative-PNA consists of, so the models are not at fault here. The issue we want to resolve is a lack of context that looking only at forecasts of the indexes results in.

When broadening out beyond the trough along the western coast of the continent, the ridge that is expected to send the PNA into strong positive territory is seen, now having retrograded slightly into the Gulf of Alaska. The movement of the ridge to the west is indeed why troughing is seen developing along the western coast. But take a look at the way the ridge extends into Alaska to see what I mean by 'lack of context'. Instead of merely topping off around Anchorage, the positive anomalies extend well into Alaska, and join up with another ridge based in Canada, the combination of which then pushes into the Arctic Circle. That doesn't mean much for the trough along the west coast of the continent, but it's certainly something we need to note, and here's why.

Take a look at Greenland again. The strong ridge is still forecasted to be positioned over Greenland, keeping the negative-NAO in place, as expected by the four-panel teleconnection graphic from above. Big deal, so what? So, the negative NAO pattern keeps colder than normal conditions in place over the Northeast U.S., Great Lakes and into the Mid-Atlantic. But with that strong ridge in Alaska and Canada, I find it more plausible that the lobe of colder weather will also affect the Midwest, parts of the Plains, and the Ohio Valley. Why? That ridge in western Canada will team up with the Greenland ridge to force the primary lobe of cold air to the south, as is already seen in the graphic above.

But it's the fact that the Gulf of Alaska ridge extends its influence into the Canadian ridge that makes me think those regions will also be affected by cold air. The alignment of the Gulf of Alaska ridge suggests it shouldn't be difficult at all for that ridge to push northeastward into Canada, where the other ridge is based. If/when this happens, the trough along the western coast of North America will be suppressed, and perhaps even displaced to the south towards the Southwest U.S., which could then allow the ridge to build back into the southwest part of Canada or even into the Pacific Northwest again.

All in all, that would allow a more positive-PNA-esque pattern to emerge (with respect to cold air hitting the mid-section of the country and not just the Northeast), even though by definition we should be in a neutral or even negative-PNA state, since that trough will still likely stick around, just a little farther south.

Whether this scenario actually plays out is something only time will tell, of course, but I wanted to emphasize this because when looking at teleconnection forecasts, you need to also know the *context*. I have gotten burned plenty of times by only going off the teleconnection forecasts (for example, only seeing a -NAO or +PNA and basing the forecast off that) and not understanding the context for that forecast (for example, the +PNA might not be as sturdy as the teleconnection forecast shows because of a strong upper level low just to the west of North America, or something along those lines).

---

All told, this provides a good basis for my outlook for the remainder of June.

- Through the middle of June, I expect colder than normal conditions to evolve for the eastern two-thirds of the country. This cooler weather will be widespread, with areas only west of the Front Range likely to see seasonal to above-normal temperatures. In terms of precipitation, any severe weather threats should stay confined to the southern portion of the country, with the jet stream and broader pattern alignment unfavorable for any severe weather outbreaks at this time.

- From the middle of June to the end of June, I expect a continuation of this cooler than normal pattern, though with a reprieve coming for the Plains and perhaps parts of the Midwest as a trough builds in to parts of western North America to return some parts of the central U.S. to more seasonal conditions. However, firmly cooler than normal conditions should persist for the eastern third of the country, especially in the Northeast. Any seasonal conditions will be pockmarked by cooler bouts of weather for those in the Midwest and Great Lakes into the Ohio Valley, though again the coldest conditions should stay further east. Storm chances should increase for the central part of the country with a return to more seasonal weather, but zonal flow aloft and the lack of a ridge in the Southeast should dissuade any significant severe threats from hitting the Central U.S., and likely from hitting the country in general.

Andrew

Tuesday, January 5, 2016

Brief Pattern Change Expected Next Week

A change in the current weather pattern, albeit a brief one, is expected next week.

PSU
Image Valid: January 12
Ensemble forecasts see strong ridging building over Alaska and extreme northwest Canada, extending from northern Siberia all the way across the Arctic Circle to the waters immediately south of Greenland. Consequentially, this will force the tropospheric polar vortex to lower latitudes, and it just so happens that ensemble guidance sees a piece of this vortex will dip south into Canada, and will exert its influence on the United States.
It's important to note that the tropospheric polar vortex will not enter the United States, it will stay well north of the Canada/US border. Cooler air will still result, but extreme cold should not be expected right now.

PSU
Image valid: January 15
By January 15th, the pattern is progressive enough so that the piece of the tropospheric polar vortex shifts east into eastern Canada. We also see strong ridging dominating the Arctic Circle, which will drop the Arctic Oscillation (AO) index well into negative territory, as we'll see a little later on in this post. Note the strong trough modeled over the Gulf of Alaska- this will maintain a positive phase of the East Pacific Oscillation (EPO). While I won't discuss the EPO in this post, that trough in the Gulf of Alaska is what will return our pattern to a more seasonal, and possibly warmer than normal pattern after this brief change to chillier temperatures.


Above 3 images from CPC
Just a brief look at the teleconnection forecasts, we see the Arctic Oscillation (AO) and North Atlantic Oscillation (NAO) both expected to drop into negative territory. This is a sign for cooler than normal weather, and as we saw earlier in this post, ensemble guidance believes a brief shot of colder weather will hit the Central and East US. The Pacific-North American (PNA) index is expected to stay positive, possibly heading more towards  neutral territory in the medium-long range, but generally should remain positive. This is likely a result of that trough in the Gulf of Alaska. That trough will keep the pattern progressive, which means the ridge that forms over the West US as a result (the positive PNA indicator) will likely drift east and spread warmer weather east.

To Summarize:

- A brief flip to colder weather is expected next week, mainly between a January 10-15 period.
- Warmer weather is expected to return after January 15th.

Andrew

Monday, January 4, 2016

January 9-12 Potential Winter Storm

There appears to be the risk for a storm system to impact the East US, particularly the Northeast, in the January 9-12 timeframe.

Tropical Tidbits
We'll first go over the forecast of the storm, and then get into it at a more analytical level. This forecast panel shows the 18z GFS forecast of precipitation type and intensity, as well as mean sea level pressure contours and 1000-500mb thickness values for the early morning of January 11th. We see a strong storm system just offshore the Northeast, producing widespread moderate to heavy rain right along the coast from New Jersey on northeastward, with light snow located in inland New York into east Pennsylvania. This solution could give copious amounts of rain and/or snow to the East Coast.

As expected, the internet is biting hard on this storm, given it could be the first real wintry system for the East this winter. Not to burst anyone's bubble, but below explains why I'm not expecting a real snow threat with this storm, and why not to bite on any forecasts yet.

Tropical Tidbits
This graphic shows us the 500-millibar vorticity values, forecasted for 12z (6 AM CST) today, Monday. That red box, all the way out near the Aleutian Islands, encompasses our storm system. That's right, the system that people are looking at is currently hundreds of miles away, closer to Russia than mainland United States. That's the first sign that we shouldn't take any model guidance at face value right now. Heck, the latest 00z GFS run came in and showed the storm pushing well out to sea, not even affecting most of the East US. I just chose to show that 18z GFS graphic so I could show what I'm talking about, and to make a few points, like this one.

Additionally, check out all the pieces of energy out ahead of our main system. If you count closely, just looking at this graphic, I can identify at least three separate storm systems downstream of our system of interest near the Aleutian Islands. Three systems is a lot for model guidance to sort out, and it doesn't help that one of those systems is also well out at sea, not even close to the radiosonde network which would help model accuracy. In sum, models are going to suffer a lot with this storm, both with the distance the storm is from the U.S., and how many systems are downstream of our storm itself.

Tropical Tidbits
This next point is specifically for the snow enthusiasts in the Northeast already getting excited for this storm. This is the 850-millibar temperature forecast for the morning of January 9th. At this point in time, our system is located somewhere in the South Plains, though it is not well-shown on this map. That's alright though, because we're looking at this image for the temperature spread across the Central and East US. All colors green and warmer are temperatures above freezing at this layer of the atmosphere (about 5,000 feet off the ground). That means that most areas east of the Mississippi River, save for Maine, Vermont, and New Hampshire, should be comfortably above freezing in the couple of days, even several hours prior to the storm actually beginning to impact the East (if it does at all).

For a good snow set-up, no matter where you may live, you want an established cold air mass before the storm begins. We saw that guideline in play with our last storm system, which dumped copious amounts of snow in the Plains into Iowa and Wisconsin, even laying down a few inches of sleet near Chicagoland. It was all that sleet and freezing rain that fell because there was no antecedent cold air mass. This go-around, we also will be lacking a pre-established cold air mass, and that really concerns me with snow prospects.

CPC
While I'm not set on the idea of a snowstorm, I am open to the concept of this actually being a storm for the Northeast. The North Atlantic Oscillation (NAO) will be negative when this storm occurs, albeit only slightly negative. This should encourage the storm to curve up the coast, though just how much 'encouragement' there is remains in question. It's completely plausible the storm goes straight out to sea, as the 00z GFS portrayed, and it's also possible it curves up the coast. I'm not confident in it going one way or the other right now, but both solutions are plausible.

To Summarize:

- There is the chance for a wintry storm system in the Northeast between the January 9-12 timeframe.
- Personally, I see a very realistic chance that this storm produces more rain than snow as a result of no antecedent cold air mass.
- Model guidance should not be trusted this far out.
- This storm could plausibly go out to sea rather than up the coast.

Andrew 

Thursday, December 24, 2015

December 26-29 Significant Winter Storm

There is growing concern that a potentially-historic snowstorm may impact the Southern Plains, with lesser, but still-substantial amounts to the north and east in the December 26-29 timeframe.


Tropical Tidbits
The system of interest is currently in the Gulf of Alaska, pushing towards the Pacific Northwest as of posting time. We see the higher vorticity values in the circled region, indicating the presence of the trough. Looking over the map right now, the pattern downstream (to the east) of this energy is rather zonal (not wavy; flow is west-to-east), which would keep this storm from going too far north. However, the flow immediately upstream (to the west) of this piece of energy is rather meridional (wavy; flow can appear to move in a north-south direction at times), which will likely play a role in the storm track later on. For now though, we can only confirm the presence of our storm system in the Gulf of Alaska.

Tropical Tidbits
The first snowfall map we'll analyze is the 00z GFS model, the most recent as of the time I am writing this post (it's currently 1:11 AM on Thursday, sleep is not my friend right now). The latest GFS shows amounts in the 6-14" range across northern, western and central Texas, with scattered swaths of 14-20", particularly in far western Texas into New Mexico, and into north-central Texas. A narrow, but intense band of amounts exceeding 24" is projected onto the southwest portion of Oklahoma into north-central Texas. Amounts in the range of 12-18" are then outlooked in much of central and northern Oklahoma, before amounts taper off to the 5-10" range from southeast Kansas through Chicago. The energy then appears to transfer east along the East Coast, dropping significant amounts in the Northeast, with New York, Massachusetts, Vermont, and New Hampshire among the states projected to receive up to 18".
This model has been quite variable with snow amounts, but has maintained consistency with the storm actually occurring, and confidence is increasing in the storm occurring in at least some format.

Tropical Tidbits
Next, we'll take a look at the Canadian GEM model forecast for this system. This model paints a different scenario, expressing the variability that still exists with this event. This model drops a general 6-18" swath across northern, western and central Texas, with the highest amounts in the far northern and western regions. Oklahoma also experiences significant snows, with a general 6-12" swath for much of the state, and even a 24" bullseye on the Oklahoma/Texas border just southeast of the Oklahoma Panhandle. Amounts then diminish to a 6-12" range in northern Missouri to northern Illinois and Indiana, southern Michigan, and boosting amounts slightly as the energy hits the Northeast.

While I'm not buying into any particular snowfall solution just yet, I am advocating a particular track. Next, I'll explain why I believe we will see the heavy snow axis fall where it is currently projected, or even further south and east than the above maps show.


Both images from CPC
The first two items to discuss are the Arctic Oscillation (AO) and North Atlantic Oscillation (NAO). The AO measures the strength of the tropospheric polar vortex- a positive AO indicates a stronger than normal polar vortex, while a negative AO indicates a weaker polar vortex. The positive phase of the AO tends to promote a more zonal flow, generally warmer than normal and less stormy. The positive phase of the NAO works similarly, promoting warmer weather in the eastern 2/3rds of the country, and zonal flow. Both of these indices are forecasted to maintain positive strength when this storm comes around, telling me that the storm will be hard-pressed to push northward like earlier model runs had suggested.

CPC
We're also looking at a positive Pacific-North American (PNA) index for when this storm is forecasted to hit. The positive phase of the PNA promotes high pressure in the west, and low pressure in the east. It's typically conducive for storms in the Midwest and Ohio Valley for this reason, and can also lead to these transfer events, which give the Northeast the threat for stormy weather as well. A typical positive PNA set up is shown below, and we are expecting this positive PNA set-up for the storm's occurrence.

NCSU
But the real kicker is a piece of energy that, in a way, is both the least and most important part of this storm.

Tropical Tidbits
The above image shows the 500mb vorticity map, forecasted by the 00z GFS for 84 hours out. We see our storm now well developed and centered in far northern Mexico, beginning to push eastward into the southern Plains. However, the point of discussion here is that area of higher vorticity in the northern Plains and Midwest, and it is this item that tells me we could see the storm track stay to the south.

That band of higher vorticity values is an area of confluence aloft. Confluence is the act of air essentially rushing into a given space- similarly, diffluence is the act of air evacuating a given space. In the atmosphere, confluence aloft can result in high pressure at the surface, which acts to force storm systems away (in this case, further to the south). It is this that completes my belief that the storm will take this more eastern track and give cities like Oklahoma City, perhaps Dallas, Chicago, Detroit, and much of the Northeast a solid snow after Christmas.

To summarize:

- A significant winter storm is forecasted to hit a large portion of the country in the December 26-29 timeframe.
- Snowfall amounts in excess of 12" cannot be ruled out for the Southern Plains, including Texas and Oklahoma.
- Snowfall amounts in excess of 6" cannot be ruled out for portions of the Midwest and Great Lakes, including Chicago and Detroit.
- Snowfall amounts in excess of 12" cannot be ruled out for the Northeast.
- High uncertainty still exists with this system.

Andrew

Sunday, December 20, 2015

Early Signals For Pattern Change in Early January

There are emerging signals for a change to a colder and snowier pattern in the early days of January 2016.

PSU
The image above shows the GFS Ensemble mean 500mb height anomaly forecast for hour 384- the infamous fantasy land, end of the run panel. The ensembles are expecting ridging to build up along the west coast of North America, with troughing taking over in the Bering Sea and Arctic Circle. This kind of pattern would likely promote an overall-cooler set-up than the one we're currently in, which will feature well above normal temperatures on Christmas Day.

You all know I wouldn't post a 384-hour graphic without good reason, so let's dive in.

CPC
The ensemble forecasts out of the Climate Prediction Center for the Pacific North American (PNA) index show a dip to negative values as we head to Christmas, but then rising to neutral, and even positive values to kick off 2016. The majority of members are in positive territory by the start of the new year. The relative consensus of most ensemble members on a neutral or positive value of the PNA is encouraging for winter weather fans. Positive PNA values typically result in colder and snowier weather for the Central and East US, while negative PNA values result in warmer weather.
Some of you may ask why it's been so warm even though the PNA was positive in December- that can be attributed to the El Nino, producing enhanced convection in a part of the Equatorial Pacific conducive for warm weather here in the U.S., however that's a topic for another post.

ESRL
A grand overview of four key teleconnections reveals this improving pattern (improving, at least in the eyes of winter weather fans). We see a continued positive EPO through the forecast timeframe- if you're more knowledgeable, you'll recall that the positive phase of the East Pacific Oscillation (EPO) encourages colder weather in the eastern 2/3rds of the country, while the negative phase encourages warmth. The WPO (West Pacific Oscillation) closely follows those guidelines as well.
As noted earlier, we see the forecasted PNA rising to at least neutral values in the long range near the start of 2016.

If all of these forecasted indices and teleconnections verify on an as-is basis (which, I may add, is rather unlikely), we could expect a cooler pattern in the Central and East US. This would be mitigated by the positive phases of the Arctic Oscillation (shown in the first image by negative height anomalies across the Arctic Circle) and North Atlantic Oscillation (shown in the first image by weak troughing over Greenland), both of which tend to discourage persistence of colder weather.

To summarize:

- There are indications that a pattern change may be on the way for the start of 2016.
- Model guidance will change drastically, and this is nowhere near set in stone. However, if this does verify to a certain degree, a cooler pattern may be on the horizon.

Andrew

Friday, September 4, 2015

Pattern Change Imminent for North America

Welcome back to The Weather Centre! We are now resuming winter weather posting, which means we're back in business for the next several months! We're kicking off this winter with a pattern change update for North America.

It is expected that a pattern change will impact the United States in the next week or two, leading to substantial air mass shifts across North America.

ESRL
Over the past week or so, we've seen a persistent, high-amplitude weather pattern over the Northern Hemisphere, particularly in the North Pacific. Deep negative height anomalies have been situated west of the Aleutian Islands, as well as along the coast of western Canada. A strong ridge has maintained position over the Aleutian Islands and across the Bering Sea. This volatile pattern has wedged the United States into a rather stagnant pattern, with warm weather over-spreading the Central United States, making pushes north and east as time has gone on.

This pattern is about to change, as we see two main playmakers rile up the atmosphere.

Tropical Tidbits
The first will be the shifting of that deep trough along the west coast of Canada south into California, and then moving north and east into Montana, as this GFS Ensemble forecast shows on the morning of this coming Sunday. Locally, this means warm weather continues for the Plains, with that ridge still not budging, as well as warmer weather in the Midwest and Northeast. However, as that trough moves eastward, we will start to see the jet stream become more zonal.

Tropical Tidbits
By Wednesday morning, we see significant changes to our atmospheric mid-levels. We now see a dominant zonal flow of the jet stream, as the smoothness of height contours over North America shows. Some slight ridging remains in place along the East Coast in the United States, but this too will be shunted away in due time, as the zonal flow is maintained by the strong storm system in the immediate vicinity of Greenland (some of you more knowledgeable weather enthusiasts may recognize this as a pattern similar to that of a +NAO wintertime pattern).

Tropical Tidbits
By Friday morning, a week from this post's publishing, we see a complete flip in the pattern from where we are currently. Strong ridging has taken over along the western coastline of North America, maximized in the Pacific Northwest into the British Columbia region. In response, similar to a +PNA pattern in the winter, we see cooler, stormier weather working its way into the Central US and East US. A note for any severe weather fanatics still watching the fall tornado season threat, I wouldn't be surprised to see some storms anywhere from Oklahoma to the North Plains under this northwest flow.

There is another factor that we will have to watch in the next couple weeks, and that is tropical storm Ignacio.

RAL/UCAR
Ignacio is currently located in the middle of the Pacific, due south of the westernmost Aleutian Islands. The image above shows forecasted storm tracks from all available GFS Ensemble members. The consensus among these members, as well as other statistical forecasting models, is to have Ignacio curve north and east, making another 'landfall' as a post-tropical system in British Columbia. From there, already-low confidence gets significantly lower, as ensemble tracks take this storm anywhere from the Arctic Circle vicinity (as shown by member AP17), or the Lake Michigan region (as per members AP10, 12, and 14).

As far as impacts, we can split it up into a number of talking points. For one, this will drastically lower forecast model skill over the next two weeks. While it isn't necessarily uncommon for post-tropical systems to make their way into the mid-latitudes, forecast models almost always see a drop in verification due to this occurrence. Therefore, long-range forecasts over the next several weeks are subject to anomalously worse verification rates.
Secondly, as Ignacio was once a Category 4 hurricane, we could see a strong storm system develop over land here in North America. Local impacts may include substantial rainfall, possibly to the point of severe weather potential, but that all depends on where the storm tracks, and if it even makes it to North America to begin with.

To summarize:

- A pattern change will unfold across North America over the next 7-14 days.
- A heat wave will impact the East US, to be replaced by cooler weather about a week from today.
- Post-tropical Ignacio will hinder forecast model accuracy, and may also bring about anomalous weather conditions in the U.S. in the next 10-20 days.
- Cooler weather will prevail in the Central US in the next 7-14 days.

Andrew

Saturday, February 7, 2015

February 22-27 Potential Winter Storm

Model guidance has been hinting at a rather strong winter storm impacting the United States around a February 22-27 period.

Tropical Tidbits
Click images to enlarge
The above image shows the GFS forecast of 500mb geopotential height values (colored shadings) and mean sea level pressure contours over the West Pacific, valid on February 16th. In this image, which is from the GFS model run on the morning of February 4th, we see a very strong low pressure system crossing Japan and moving away from the country as it does so, with a minimum central pressure here of 987 millibars. This is a very strong system, but one might argue that can be expected from long range guidance, which can/does tend to over-amplify storms in long-range forecasts.

Since that forecast was made, at least 5 other GFS runs came in with very similar solutions, meaning this could be a valid storm potential. You'll notice that the timeframe isn't exactly the same on each graphic, but the storm impacting Japan between February 16-17 is generally agreed upon.

Tropical Tidbits

Tropical Tidbits

Tropical Tidbits

Tropical Tidbits

Tropical Tidbits
While this model remains inconsistent as far as showing this storm run-after-run, the general concept of a storm in this timeframe is still present (for now).

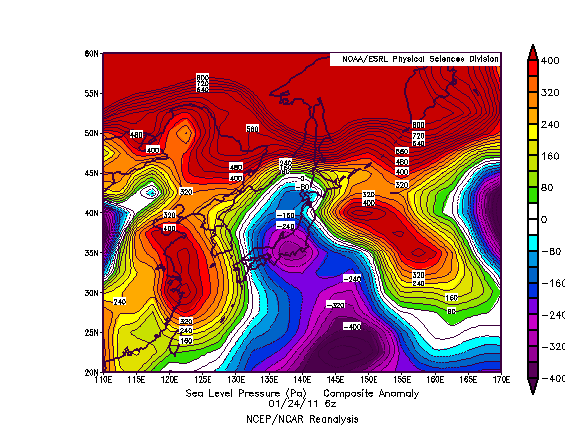
When we apply the Typhoon Rule, which states weather phenomena occurring in Japan is reciprocated in the United States 6-10 days later, we can extrapolate the storm in this February 16-17 timeframe to get a rough estimate of a February 22-27 correlation here in the US, padding in a couple days for uncertainty. But we may also be able to figure out where it tracks.

ESRL
The above image shows sea level pressure anomalies on the morning of January 24th, 2011. On this day, we saw a storm system cross Japan and rapidly strengthen as it began to exit the eastern coast of this country. Just for kicks, let's apply the Typhoon Rule here. If we do so, we likely saw a storm system impact the country between January 30th and February 3rd, 2011.
Some of you might remember that as the Groundhog Day Blizzard of 2011, which dropped close to 24" of snow in Chicago, IL, as well as incredible ice accumulations in the cold sector of this storm. When we compare the projected track of our mid-February storm in the GFS images above, we see that some (not all) forecasts have the upcoming low taking a similar track as the eventual-Groundhog Blizzard did. That's not to say I'm expecting another massive blizzard. I'm just trying to show where this storm could end up tracking, and that could be through the Midwest yet again.

Tropical Tidbits
There's also the chance we see this storm go through the East US and impact that area primarily. The reasoning behind this is the expected ridge-out-west and trough-out-east pattern which will likely deliver more than one round of accumulating snow to the East (more on this can be found in yesterday's post). The image above shows the GFS ensemble outlook at the very end of its run, depicting 500-mb geopotential height anomalies for February 22, 2015. We see a gradual departure of the trough in the East into Greenland, though the ridge in the West is still persisting. Personally, I'd bet more on the trough staying put purely out of persistence forecasting, but that's why you take model guidance with your own opinion. If this forecast did work out, however, the storm could impact the Central US and East US, whereas the trough staying put would result in an impact likely for the East.

CPC
If we factor in tropical forcing, we get yet another different picture. When the timeframe for this storm rolls around, enhanced tropical convection is forecasted (not shown here) to be placed in an area around and just east of the 90ª East longitude line, which places us in Phases 4 or 5 of the Madden-Julian Oscillation (MJO). The above graphic shows precipitation anomalies on the left two columns; we'll ignore the colorful columns on the right for now. When we look at precipitation anomalies during Phase 4 and 5 in a January-February-March period, we tend to see the Central US into the Northeast getting in on storm activity. This could mean the storm in late February, if it happens to begin with, will hit both the Central US and East US, but anything beyond that is purely guessing.

To summarize:

- There are indications a strong storm could hit Japan in the middle of February.
- This could result in a strong storm in the United States between February 22 and February 27.
- It is not known who will/could be affected by this system yet.
- As the post thoroughly showed, significant uncertainty surrounds this event.

Andrew

Monday, February 2, 2015

February 10-15 Potential Winter Storm

I'm watching for the potential for wintry weather in the February 10-15 period.

Tropical Tidbits
The image above shows 500mb geopotential height values for the morning of February 5th, with mean sea level pressure (MSLP) contours superimposed. In this graphic, we see two areas of low pressure over the Western Pacific. The more dominant system is located south and east of Japan, with another piece of energy just west of this island nation. In the forecast hours after this graphic, it appears the energy west of Japan transfers to the storm east of Japan. From there, the dominant low moves generally northeast, away from Japan. When we use the Typhoon Rule, which states weather phenomena occurring over Japan is reciprocated in the US 6-10 days later, a storm in the US might be expected in a February 10-15th period, adding a day for some uncertainty I have on timing. Additionally, the transfer of energy over Japan tells me we could be looking at a transfer scenario from the Midwest/Great Lakes/Ohio Valley into the Northeast.

ESRL
We can take a look at teleconnections to get a glimpse at what this storm might do. For this post, we'll pay attention to the top-right North Atlantic Oscillation (NAO) outlook. Notice how the index rises from negative to neutral territory right in the timeframe of this potential winter storm. The NAO switching phases is known to be a red flag for snowstorms in the Northeast, as the risk of snow events in that area tend to rise when this switching of phases occurs. This could support the idea of a transfer storm to the Northeast, like the GFS showed (in a likely overdone projection) in its 12z forecast:

Tropical Tidbits

To summarize:

- Model guidance is indicating a winter storm may impact the country in a February 10-15 period.
- As of now, a transfer low from the North-Central US to the East Coast may be a likely solution.
- As usual, high uncertainty still exists.

Andrew