Monday, August 18, 2014

Modoki El Nino Gaining Control; Winter Outlook Grows Colder

It appears that a Central-Based, or Modoki El Nino is now gaining control, resulting in the outlook for this winter growing colder.

JAMSTEC
Click to enlarge
The image above, provided by the JAMSTEC agency, shows typical sea surface temperature anomalies during a Modoki El Nino. The presence of this Modoki Nino is clearly shown by the positive anomalies in the central portion of the Pacific, hence the interchangeability between Modoki and Central-Based El Nino. During the Modoki Nino, cooler than normal SST anomalies tend to appear offshore Ecuador, something we'll discuss a little later in this post. Looking towards the north Pacific, predominantly warm SST anomalies are observed, from the Sea of Japan, to the Bering Sea, to the Gulf of Alaska. Warm water anomalies are also recorded near Baja California.
Out in the Atlantic, warmer than normal waters surround Greenland and are placed into western Europe, with cool water providing a separation between that mass of warmth, and the second body of warm water juxtaposed near the Canadian Maritimes. The Indian Ocean also exhibits a slightly negative Indian Ocean Dipole signal (identified by cold water near Somalia and warm water near India) during Modoki El Ninos.

Let's now compare this typical  Modoki set-up with today's SST anomalies.

ESRL
Click to enlarge
Taking a look around the globe, we can identify several points of interest and discussion when comparing the Modoki composite image, and the daily SST anomalies from August 17th. Beginning in the Pacific, we see warm water anomalies off the coast of Ecuador, and cool anomalies in the central Pacific, basically opposite of a Modoki set-up. We'll dive deeper into that a little later in this post. Moving up to the North Pacific, we observe a swath of warmer than normal water temperatures in the Northeast Pacific/Gulf of Alaska, nearly identical to the anomalies seen during a Modoki Nino. The comparison is once again similar when we confirm warmer than normal waters stationed off Baja California, as also seen in the composite image. The Sea of Japan was well above normal earlier this week, as it is during typical Modoki El Nino events, but has since cooled due to the passage of Typhoon Halong over that area.
Transitioning to the Atlantic, additional similarities are found. We can see the warmer than normal waters near Greenland, pushing east into western Europe, as was also found in the Modoki composite image. There isn't much of a cold pool of water just south of Greenland, but warmth is observed near the Canadian Maritimes. The Indian Ocean is also displaying the same negative IOD pattern observed in a typical Modoki El Nino event.

Now, all of these similarities are impressive, but what about the El Nino itself in the Pacific? It looks nonexistent- actually opposite, of what the Modoki composite image shows us.

CPC
Refresh page if animation stops looping
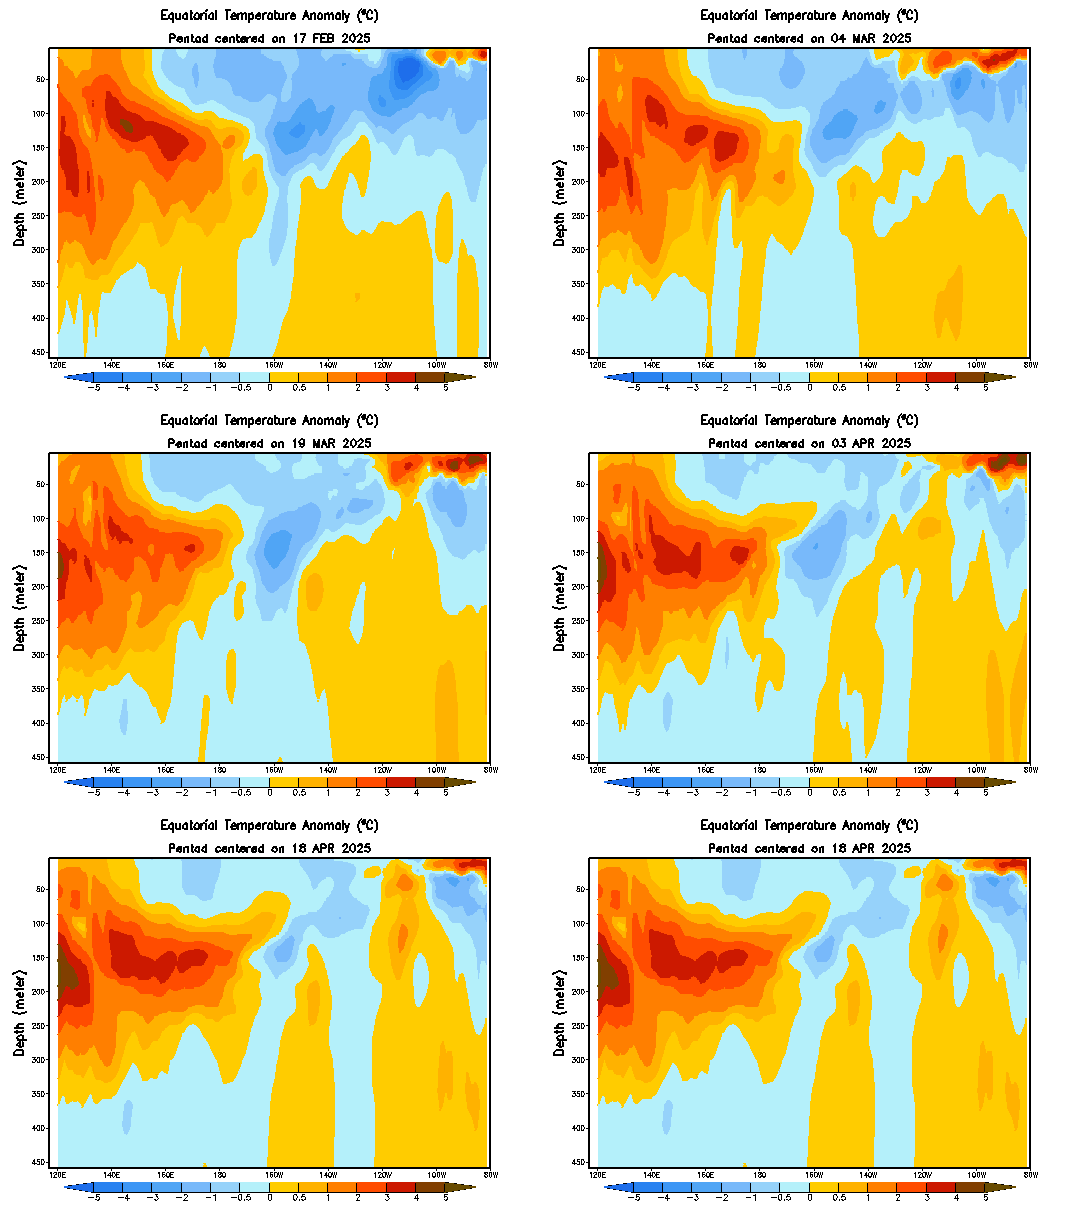
The animation above shows us water temperature anomalies, the same variable examined earlier in this post, but now analyzed on a depth chart. The legend on the left displays depth in meters along the Equator, while the bottom legend indicates longitude lines. Looking over the animation, we can see that opposite pattern of cool waters in the central Pacific (top-middle of animation) and warm waters in the eastern Pacific (top-right of animation), but what is stirring below is even more interesting. We find a body of cold water pushing to the surface in the eastern Pacific, as well as a swath of positive water temperature anomalies manifesting itself below the surface in the central Pacific. Put two and two together, and the Modoki signal in the Central Pacific is definitely present, just not at the surface yet.

Now that we have shown how the Modoki El Nino is nearly completely present in water temperature anomalies around the globe, let's talk about the effects it may have on the upcoming winter.

JAMSTEC
Click to enlarge
The graphic above displays worldwide temperature anomalies during a Modoki El Nino. As we can see, cold weather is typically observed in much of the Central US during a Modoki El Nino, while warmth prevails in the Western US. Slightly warmer than normal anomalies are also visible along the Eastern Seaboard.
What this tells us is that, at least for now, the risk of another cold winter in the Central US is rising, while a warm winter along the West and into Alaska is also becoming a real possibility. Those in the East may need to watch for a slightly warmer than normal winter.

Andrew

Sunday, August 17, 2014

Probability of Negative NAO During Upcoming Winter Increasing

The likelihood that we will see high pressure over Greenland this winter, a sign of the negative North Atlantic Oscillation, is on the rise.

ESRL
The image above shows sea surface temperature anomalies for the day of August 16, 2014. In this image, we can see quite a few areas of interest that we are monitoring for the upcoming winter, but today we'll focus in on Greenland and around the Canadian Maritimes. Looking towards that part of the world, we see a swath of well above normal SST anomalies stretching from the waters south of Greenland towards the Arctic circle. The warm waters also extend to the east, immediately offshore of Greenland.

It is well known that sea surface temperature anomalies can exert a significant influence on the presence of high or low pressure in a given area. For example, areas with warmer than normal waters tend to observe high pressure more often that low pressure, while colder than normal SST anomalies usually result in stormy conditions prevailing over quiet conditions. This was observed well last winter, when the body of positive SST anomalies in the northeast Pacific brought about strong high pressure along the western coast of North America, which permitted the cold weather to penetrate deep into the US.

In Greenland, with the presence of a rather large swath of warmer than normal waters, I wouldn't be surprised to see persistent ridging over this part of the world this winter. If such a scenario does play out, we would enter the negative phase of the North Atlantic Oscillation (NAO), which would allow cold and stormy conditions to prevail over the Central and East US, the latter of which may experience episodes of intense snowstorms, as can happen in negative NAO events.

CPC
In the graphic above, we see SST anomalies over four different parts of the Pacific Ocean, centered along the Equator. Nino region 4 is located near the Oceania region, while Nino region 1+2 is centered just offshore Ecuador. By looking at these panels, we can identify a body of warm water on the surface in the west-central Pacific in Nino region 4, as well as the far east Equatorial Pacific in Nino regions 1+2 and region 3.

It is expected that all of these regions may experience additional warming as we progress into Fall, which is when we anticipate the emergence of a Weak El Nino (SST anomalies +0.5 to 1.0 degrees above normal).

Weak El Nino's affect the United States in many ways, but the primary effect is through manipulation of the jet stream. When this happens, the jet stream is forced south along the Eastern Seaboard, allowing cold air to flow deep into the Central and East US. Storm systems are then pushed south as well, and end up following the jet stream along the South US before shooting north as the jet stream is pulled up towards Greenland, where a ridge (Negative NAO) resides. Consequentially, snowstorms pose threats to the Northeast and East Coast, in addition to the cold weather.

The negative NAO and weak El Nino generally tie into each other, as they seem to work in a tandem. If current projections verify for this winter, and the SST anomalies near Greenland persist, the likelihood of a negative NAO throughout the winter significantly rises.

Andrew

Friday, August 15, 2014

New Climate Model Outlooks Fix Errors; Cool, Snowy Winter Possible

Long range climate model projections of the upcoming winter season, the same ones we discussed a little while back, have been updated. The latest models still retain errors, but two models have come in with drastic improvements.
Bear in mind the typical caveats with long range forecasts still apply.

CPC
The image above shows a compilation of multiple long range outlooks, projecting the El Nino-Southern Oscillation phenomenon from the present to next spring. In this chart, we can see the majority of models favoring an immediate commencement to the El Nino expected to form later this year. The issue here, which we elaborated on in the link above, is that these models want to make the El Nino start immediately, something unlikely to happen. Complicating the situation further is the fact that these models want to bring the El Nino to Moderate (+1º to +1.5º above normal) or even Strong (over +1.5º above normal) levels by this winter. Again, this is unlikely to happen. Consequentially, we have been forced to discard these forecasts, as the incorrect SST projections then ruin the remainder of the forecasts.
The new update to these models came in to me today, and I was surprised to find two models that have changed their tune. In the chart above, instead of all models going up and up with the El Nino, the GFDL (turquoise colored line) and GFDL_FLOR (beige line) prefer either an ENSO-Neutral situation, where the El Nino is unable to form, or a weak El Nino, which is what my preference is for this winter. It finally seems as if we have two models that may stand a chance at verifying this winter.

Without further ado, let's review the forecasts from these two models for this winter.

CPC
 The first model we will review for the temperature outlook is the GFDL_FLOR. The image above shows projected temperatures across the United States for December-January-February 2014-2015. In this graphic, we see that the model keeps the majority of Alaska and western Canada warm, which can be indicative of persistent ridging over the area. Whether that is the case, we don't know, but such a feature would help chances for a cold Central/East US winter. Now looking at the United States, we find the majority of the nation experiencing average temperatures for the winter, with the Plains experiencing slightly below normal anomalies.
This is a rather substantial shift from earlier forecasts of a blowtorch (excessively warm) winter for the nation, which was due to the incorrect SST forecasts. It can be expected that models may project normal anomalies, because these forecasts are being made for months out. However, with this being the first forecast that is not retaining major SST flaws, things are looking up for those wishing for a cold winter.

CPC

Turning our attention to the GFDL model, we find a slightly different temperature forecast in store. Much of the Central and Western US is experiencing average to slightly below average temperatures, while the Great Lakes, Southeast and East US in general experiences a warm winter. We see this warmth extend into northeast Canada and towards Greenland, which makes me think that we may need to watch for ridging building off the East Coast if this forecast is correct (which, as we know by now, is not a given).

CPC
We now turn our focus on the precipitation outlooks from the two models. The GFDL model, pictured above, shows a wide swath of above-normal precipitation extending from Texas to south-central Canada, bringing the heaviest anomalies to the southern Midwest and western Ohio Valley regions. Wetter than normal conditions are also observed across the Eastern Seaboard, while dry weather prevails into the West Coast.
I'm not willing to say much on this outlook just yet, but since this is the first forecast that doesn't have that dreadful SST flaw, this sort of precipitation pattern may bear watching for this winter. If it did verify, it could spell disaster for California and other drought-affected regions.

CPC
Taking a look at the GFDL_FLOR model, we see a somewhat similar outlook as the one portrayed by the GFDL system. In this outlook, the December-January-February period features a very dry West US, remarkably drier than the GFDL model outlook. Slightly above normal precipitation anomalies extend from the Southern Plains and Gulf Coast into the Midwest and Great Lakes. The Central Plains is also included in this wet trend.
Again, though there's not much else to say here, it could bear watching.

CPC
Lastly, we'll take a look at the model-projected upper air pattern for the coming winter. The image above shows the Z200 outlook over December-January-February from the GFDL model. We want to maintain focus more on the contour lines than the color shades for this post. Taking a look around North America, we find a ridging signal over the West Coast and into Alaska. As we've discussed extensively, persistent above-normal water temperature anomalies in the Gulf of Alaska may support such a scenario, which could then lead to another chilly winter. Looking downstream, we do see a slight suppression in the contour lines, potentially indicative of some stormy weather. We saw a similar outlook in the months leading up to last winter.
Something else to note is the suppressed contour lines over Japan. This could indicate stormy weather there, and if we apply the Typhoon Rule, it could then affect us here in a substantial way.

CPC
Finally, shifting to the Z200 outlook from the GFDL_FLOR guidance system, we still see a cold signal across North America. Eerily similar to outlooks from last year anticipating the winter of 2013-2014, we see strong ridging over the West Coast and into Alaska. This ridge looks to be of similar strength to the one observed last winter, which was the mechanism responsible for the polar vortex scraping the northern US. Once again, we see suppressed contour lines in Japan, again indicative of stormy weather. The most interesting feature, by far, is the depression of contour lines over eastern Canada and into the United States. This is definitely a cold weather signal, dare I say the same signal that eventually brought the polar vortex south. I'm not saying that whole episode will happen again, but if this model is right, cold weather becomes a significant possibility.

All of this looks pretty supportive of a cold and snowy winter, but when it comes down to it, remember that this all rests in the realm of possibility, not certainty. Things do look good from these error-corrected models, but we will have to wait and see if these solutions stick with the updated model forecasts next month.

Andrew

Thursday, August 14, 2014

Sea of Japan Rapidly Cooling; Winter Implications Possible

The Sea of Japan has experienced rapid cooling in recent days, something that could come into play later on this winter.

NOAA
The image above, recorded on August 4th, 2014, shows sea surface temperature anomalies across the Pacific Ocean basin, extending from eastern Asia to the west coast of North America, and down to Australia. Though there are many things to be analyzed in this image, we want to focus in on the Sea of Japan, in the top left corner of this image. The Sea of Japan is located between mainland Asia and the island nation of Japan. On August 4th, SST anomalies read well above normal in this area. This was a concerning feature, as above normal water temperatures can induce persistent high pressure to form over the area, an ability well documented this past winter with positive SST anomalies in the northeast Pacific, and consequential high pressure in that same area, which enabled the polar vortex to grace the northern US.
The feature was primarily of concern for winter weather fans, as the persistent high pressure forming over Japan due to the warmer than normal Sea of Japan could continue into the fall and winter, which would then allow for increased risks of warmth in the United States during the coming winter season. The mechanism which may allow for this warm winter would be the highly-touted Typhoon Rule.

In just 10 days, however, the scenario for the coming winter changed drastically.

NOAA
The image above shows sea surface temperature anomalies, still projected over the same part of the world, but now valid on August 14th, 2014. Gazing around the chart, we find a stunning reversal in water temperatures in the Sea of Japan. Instead of +3.00º to +4.00º-plus anomalies in the Sea of Japan, we now see widespread negative or neutral water temperature anomalies. This rapid cooling also appears to have affected the waters immediately south of the Sea of Japan.
It's quite possible, even likely, that the destruction of these warm water anomalies is due to a strong low pressure system traversing the Sea of Japan. It is quite common for strong cyclones to "mix" the water it passes over, reducing warm water temperature anomalies in the process. It looks like this same process has happened in the Sea of Japan.
If, and I say 'if' because things can very much change in the next several months, these cool water temperatures are to sustain themselves in the Sea of Japan, and warm waters do not return to the area, the chances of a warm winter would likely be reduced. However, we'll need time to monitor this development for another handful of weeks to see exactly what will end up happening.

Andrew

Monday, August 11, 2014

Using Summertime Patterns to Predict Upcoming Winter Conditions

The hunt is now on more fiercely than ever: with meteorology growing and advancing at exponential rates in the last few decades to the present day, researchers are working harder than ever to find patterns in the weather to accurately predict long range conditions, months in advance. One aspect of this hunt is being able to predict the upcoming winter using conditions observed in the fall, or even summer. We'll take the time today to discuss methods that may or may not be useful in such long range predictions.

1. Nature Signs
This is a personal favorite of mine, due to the mystery surrounding it. Many weather enthusiasts, and people in general, believe that nature can point us to the intensity (or lack thereof) of the upcoming winter. I've heard mentions of trees producing anomalous fruit in the summer, animals acting in a suspicious manner, and even the color of certain shrubs and plants in the preceding summer/fall. I've even taken it upon myself to monitor roadkill anomalies in the fall, wondering if increased (decreased) animal activity in the fall may indicate a more (less) intense winter ahead, hence the above normal (below normal) roadkill sightings.
The unfortunate truth is that we don't know if these methods work, and likely will never know. The concept is very similar to us as a human race. We monitor certain trees and animals for signs of oddity, but that's like monitoring a certain person for an oddity. It doesn't work, because each person is different than the person next to them. As a race, humanity is quite similar across the board. The same goes with certain species of trees, animals, etc. But we can't observe a few trees and/or animals and make a qualified deduction from it. In order to determine any possible connection between nature anomalies and winter, a large-scale (covering a plethora of states) operation would likely be needed to monitor great masses of the same type of animal/tree, and then attempt to make a reasonable deduction on any winter prediction abilities.

Squirrels are commonly looked to for their ability to predict the upcoming winter, with observers monitoring a squirrel's effort to collect nuts earlier (or later) on in the year.


2. Six-Month Separation
This method involves monitoring conditions in June-July-August to see if conditions six months later (December-January-February) are correlated. The method likely stems from the question of cyclical patterns repeating on a regular, monthly scale; in this case, half a year. One might believe that Arctic 500mb heights in the summer may be related to Arctic 500mb heights that following winter, or the same scenario, except over North America, etc.
The truth behind this method is that it does not work a heavy majority of the time. I did some research last winter, where I compared monthly Arctic Oscillation (AO), North Atlantic Oscillation (NAO), and Pacific-North American (PNA) index values from June-July-August to values for the following December-January-February to determine any correlation. Although I no longer have the exact values with me, I can recall there being little to no correlation between any of the indices' summer and winter values. Looking back, I believe the PNA actually ended up seeing a near-perfect split of 50% of years recording a positive summer PNA and negative winter PNA, and 50% of years recording a positive summer PNA and positive winter PNA, or negative rather than positive for both timeframes. The Arctic Oscillation may have had the "highest" anomaly, with the split coming in at 40%-60% when comparing number of years with positive summer/winter value correlations and negative summer/winter value correlations. To make a long story short, this method is not one worth using.

So far, we've discussed items that either don't work in long range forecasting, or their effectiveness has gone undetermined. Let's now go over some items that do have merit in the long range forecasting field.

3. Sea Surface Temperature Anomalies
Long range forecasters often look to the oceans for their outlooks. Multiple oscillations reside in oceans all around the world, with many of them spreading their impacts on a global scale. Forecasters tend to believe that these long-term oscillations, which may remain in their same state for months or years at a time, can predict winter conditions as far out as summer.
There is definitely some truth to this claim. Persistent SST anomalies in a certain part of the globe can allow forecasters to get a glimpse at the weather for multiple months ahead. Long-term oscillations, like the Pacific Decadal Oscillation (PDO) or Atlantic-Multidecadal Oscillation (AMO), can remain in their same positive or negative phase for years, or even decades, at a time. Some shorter-term oscillations, like the El Nino-Southern Oscillation (ENSO) phenomenon, can still allow for long range outlooks, valid for months in advance.

SST anomalies are often believed to be one of the best & most reliable predictors of long range weather.
4. Soil Moisture & Drought
This theory stems from the concept of feedback loops, which entail that something already in a bad situation gets continually worse, because that something is harming the things trying to improve the situation. In our case, we can apply this to drought. If a drought forms, the soil is anomalously below-normal in soil moisture, making the earth dry. As a result, clouds cannot form, meaning rain cannot fall. This makes the drought worse, and makes for a vicious cycle that continues the drought. Storm systems that move over the drought-affected region cannot produce as much rain as in other regions, because the storm can't draw water from the dry soil. Similarly, areas with above normal soil moisture may see rain continue, as more moisture is available in the soil than is necessary. Thus, the air becomes unusually humid, and any storms that form over this region can produce heavy rainfall, keeping the soil on a wet level.
This method of forecasting is more of a hit-or-miss method. This is because, while the theory of these feedback loops is sound (to an extent), a plethora of external forces, made up of oscillations in the oceans and upper atmosphere, can shift and change to bring rain to drought areas, or deprive precipitation to rain-soaked land. The atmosphere is one big, constantly-changing chess board, if you will, and some pieces happen to be weaker than others. While this drought/soil moisture method of long range forecasting can work, other factors must be taken into account as well.

We've only reviewed a few of many long range patterns known in the world of weather, but hopefully this gives you an understanding of some aspects of long range forecasting. While some methods don't tend to work well, others have experienced a decent amount of success. The hunt for a long range predictor with considerable accuracy will continue into the foreseeable future.

Andrew