Showing posts with label January 2016. Show all posts

Tuesday, January 19, 2016

January 22-25 Potentially Historic Winter Storm

A potentially historic winter storm looks to be unfolding for portions of the Eastern U.S.

Tropical Tidbits
A low pressure system is forecasted to develop in the South US and push northeastward to the area just offshore the Mid-Atlantic, with this coastal storm fully unfolding around January 23rd-24th. The above image shows the GFS 500mb geopotential height contours and mean sea level pressure values for the morning of January 24th. We see the snowstorm located fairly out to sea, at approximately 985 millibars. This track would produce the snow map below, taking this solution verbatim.

Tropical Tidbits
This solution would bring about 6-12" of snow to the Kentucky and Tennessee region, extending into extreme southern Indiana and a good chunk of southern Ohio. We also see similar amounts into northern Arkansas and southern Missouri, as well as North Carolina. Amounts on the order of 12-24" are outlooked for West Virginia, particularly the southern part of the state, into the majority of central Virginia, New Jersey, and eastern Pennsylvania into southern New York, with some slightly lower amounts further east into Massachusetts. Long Island is also forecasted to receive upwards of 12" if this solution were to verify.

Tropical Tidbits
To emphasize how critical the placement of this system will be, take a look at the ECMWF model's 500mb geopotential heights and mean sea level pressure values for the morning of January 24th, the same timeframe as the GFS graphic. We see the system at 984 millibars, pretty similar to the GFS, but the system is clearly displaced further west. Given how anomalously warm the Atlantic currently is, this shift could easily push those two to three feet amounts inland, and leave the coastline with rainy conditions. This run of the ECMWF has snowfall amounts of over 30" in central Virginia, but lesser accumulations the further north and east you go.

Tropical Tidbits
The GEM model shows amounts in the 6-12 inch range for most of Missouri into the southern parts of Illinois, Indiana and Ohio, as well as much of Kentucky and northern Tennessee into western North Carolina. Amounts in excess of 30" are forecasted from Maryland into Pennsylvania, certainly an incredible amount of snow, but not entirely off the table given how strong and persistent this system may end up being. Again, the placement of this storm will be critical to who gets the heaviest accumulations, and we likely won't know who will receive this jackpot until the storm is actually happening.

Tropical Tidbits
One last bit of advice, do not bite on any particular model run for this storm. The strength of this storm, as well as how long-lasting it will be, among other factors, makes me way too uneasy to trust any single solution, hence why I presented a plethora of models here. The above graphic shows GFS ensemble spread in MSLP values for this storm. The warmer colors to the left and right of the system indicate increased uncertainty with where the storm will track. Again, this emphasizes how no single solution is set in stone, and thus should not be taken at face value. A lot of change will happen in the next several model cycles, and the heaviest amounts could plausibly shift a substantial bit as these changes unfold.

To summarize:

- A potentially historic snowstorm is forecasted to occur along the East Coast over the January 22-25 period.
- Currently, the Maryland/Virginia/Pennsylvania region is on track to receive the heaviest amounts.
- The heaviest accumulations could reach or exceed 30".
- Enough uncertainty still exists to change the storm track substantially, as well as shift the heavy snow axis and amounts.

Andrew

Friday, January 8, 2016

January 9-11 Potentially Significant Winter Storm

A potentially-significant winter storm appears to be unfolding in the January 9-11 timeframe.

Before we even dive into this storm, it's crucial to acknowledge that there are two model guidance 'camps' for this storm. As a result, there is unusually high uncertainty, so keep that in mind while reading this post.

Tropical Tidbits
The first solution we'll look at is the east-and-weaker idea. This is the latest GFS model's projected snowfall accumulation through Sunday morning. In this forecast, we see a swath of about 4-8" from southwest Missouri into extreme southwest Illinois, with a stripe of 2-4" on a northeast path until about Gary, Indiana. From that point, amounts on the order of 4-8" are outlooked for much of Michigan, particularly from the extreme southwest part of the state into the northeast part of the state.

This solution has been gaining ground in the last few model cycles, especially against the second model solution, which we'll analyze next.

Tropical Tidbits
The other solution being analyzed is a further northwest and stronger storm track. This is the 12z RGEM model, and it shows a solid 4-8" across much of the southern half of Missouri, with a small jackpot zone of 12-16" from extreme southwest Illinois into central Illinois. A zone of about 5-10" is outlooked for the Chicagoland area into the western half of Michigan.

This solution would appease many in the Midwest and Great Lakes regions looking for snowfall, but this particular solution is been losing traction to the weaker/southeast track in the last few model cycles.

Despite high model uncertainty, and the fact that I've seen stranger things happen, I'm expecting that weaker & southeast track to win out.

To summarize:

- A potentially significant winter storm is expected in the January 9-11 timeframe.
- High model uncertainty exists.
- A 2-6" snowfall swath could impact a southwest-to-northeast line from southwest Missouri to northeast Michigan.

Andrew

Tuesday, January 5, 2016

Stratospheric Vortex Under Attack, But Holding Strong

The stratospheric polar vortex looks to come under attack in the next several days, and possibly beyond, but all indications are that this attack will be weak, and the polar vortex aloft will remain strong.

We'll begin with a current look at the stratosphere.

CPC
(Refresh page if animation stops looping)
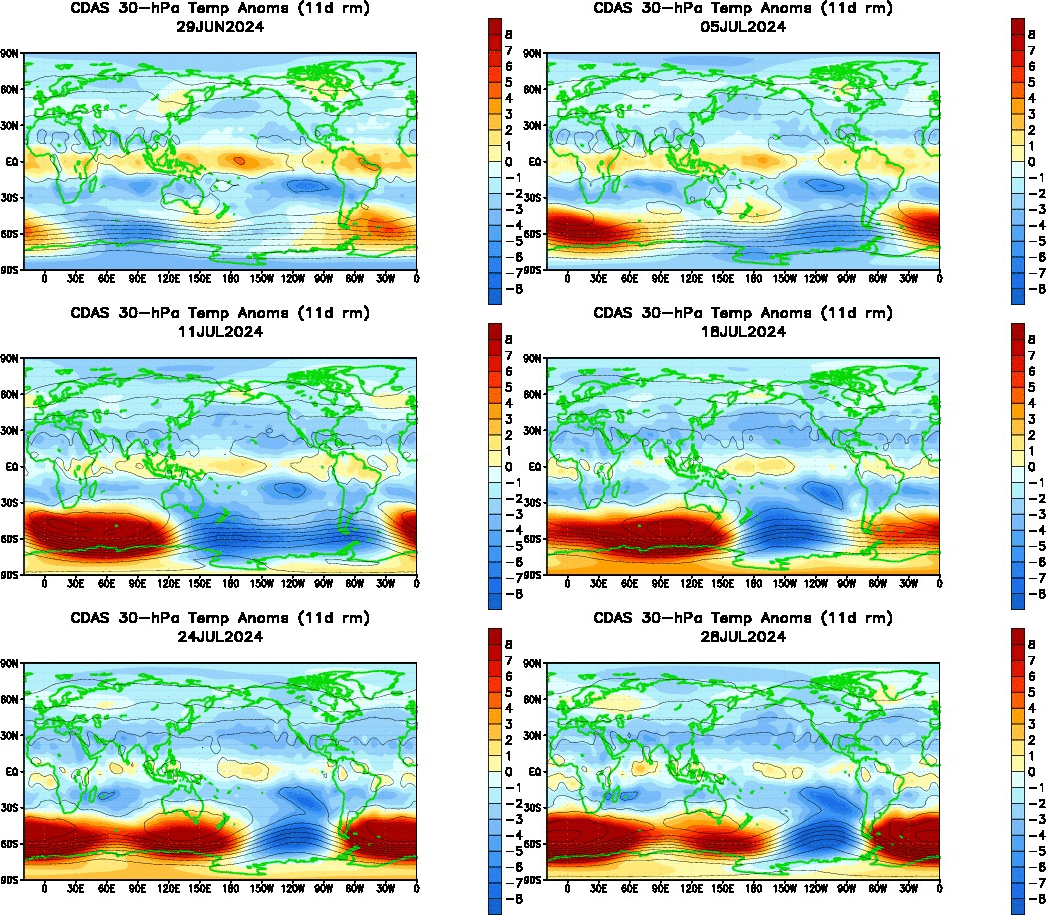
This animation above shows temperature anomalies at the 30-hPa level of the stratosphere, just above the middle part of the stratosphere. Note how over the past month we've seen a few instances of minor warming occurring at 'lower' latitudes, but never reaching a strength adequate enough to be an actual stratospheric warming event. Consequentially, the stratospheric polar vortex has remained pretty much undisturbed. There is some warming commencing over the Himalayan mountain region, and this could incite another minor warming event to spread over the north Pacific, as has happened before in the last 30 days on this animation. Whether it builds into anything substantial remains to be seen, but as the analysis below shows, I'm not optimistic.

FU-Berlin
The first image we'll analyze is a longitude-by-height chart, forecasted by the ECMWF model for five days' time. This chart is forecasting the presence of a geopotential Wave-1 event in the stratosphere. As the phrase 'Wave-1' indicates, the forecast here is for the risk of a single body of high pressure (hence Wave-1) forming aloft to try and displace the polar vortex. The legend on the left indicates this risk is highest from the 1-millibar to 10-millibar region, where geopotential values are highest and the warm colors are most prominent. This is a pretty strong Wave-1 event, but because it is centered above the 10-millibar level, and it will weaken shortly after this time period five days out, I'm not expecting any long-term damage to the stratospheric polar vortex.

FU-Berlin
Another tool we can use are time-by-height charts for different levels of the atmosphere to see how much, if any pressure is being applied to the polar vortex. It looks a little intimidating at first, but we'll break it down below.

The top panel shows us the forecast for Wave-1 (explained above) and Wave-2 temperature attacks at the 10-millibar level. The Wave-2 event is where one body or more of high pressure / warm temperatures form aloft (in this case, at the 10-millibar level) and try to split the polar vortex into two vortexes, hence the '2' in Wave-2. Notice the forecast for a Wave-1 event peaking at that 5-day forecast period, which we analyzed above, but then that Wave-2 line starting to rise up towards the end of the forecast period, ten days away. That could be something to monitor, but when we consider Wave-2 events are weaker than Wave-1 events, I'm not particularly encouraged by it.
This description of that top panel also applies to the third panel from the top, except now valid at the 30-millibar level. In this case, however, notice a sustained elevated Wave-1 attack throughout the forecast period, but also a strengthening Wave-2 parameter towards the end of the forecast period. Again, perhaps something to watch, but I'm not exactly keen on it impacting the vortex significantly right now.

Panels 2 and 4 from the top are nearly identical to the first and third panels described above, but these new panels show us Wave-1 and Wave-2 attacks from a geopotential (ridges instead of warm temperatures, although in essence they tend to occur together) standpoint. Note in Panel 2, showing us the forecast at the 10-millibar level, a sustained Wave-1 attack, and a pretty strong one at that, throughout the forecast period. We also see a strengthening Wave-2 event at the end of the forecast period.
The situation in the fourth panel, showing geopotential values at the 30-millibar level, is different than the 10-millibar level. We see a pretty strong Wave-1 event, but a weakening Wave-2 episode. This piques my interest, just because I want to see how that evolves more than anything, and may be something to watch down the road.

To summarize:

- Minor warming has occurred in the stratosphere over the last month, but has had very little impact on the polar vortex.
- Additional minor warming is forecast to occur over the next several days, again with little impact in the lower stratosphere.
- Long-range guidance indicates some items of interest beyond Day 10 forecasts, but I'm personally pessimistic as to the chance of a stratospheric warming event.
- This may keep the chances for a large-scale, significant cold weather event relatively low, speaking strictly from a stratospheric viewpoint.

Andrew

Brief Pattern Change Expected Next Week

A change in the current weather pattern, albeit a brief one, is expected next week.

PSU
Image Valid: January 12
Ensemble forecasts see strong ridging building over Alaska and extreme northwest Canada, extending from northern Siberia all the way across the Arctic Circle to the waters immediately south of Greenland. Consequentially, this will force the tropospheric polar vortex to lower latitudes, and it just so happens that ensemble guidance sees a piece of this vortex will dip south into Canada, and will exert its influence on the United States.
It's important to note that the tropospheric polar vortex will not enter the United States, it will stay well north of the Canada/US border. Cooler air will still result, but extreme cold should not be expected right now.

PSU
Image valid: January 15
By January 15th, the pattern is progressive enough so that the piece of the tropospheric polar vortex shifts east into eastern Canada. We also see strong ridging dominating the Arctic Circle, which will drop the Arctic Oscillation (AO) index well into negative territory, as we'll see a little later on in this post. Note the strong trough modeled over the Gulf of Alaska- this will maintain a positive phase of the East Pacific Oscillation (EPO). While I won't discuss the EPO in this post, that trough in the Gulf of Alaska is what will return our pattern to a more seasonal, and possibly warmer than normal pattern after this brief change to chillier temperatures.


Above 3 images from CPC
Just a brief look at the teleconnection forecasts, we see the Arctic Oscillation (AO) and North Atlantic Oscillation (NAO) both expected to drop into negative territory. This is a sign for cooler than normal weather, and as we saw earlier in this post, ensemble guidance believes a brief shot of colder weather will hit the Central and East US. The Pacific-North American (PNA) index is expected to stay positive, possibly heading more towards  neutral territory in the medium-long range, but generally should remain positive. This is likely a result of that trough in the Gulf of Alaska. That trough will keep the pattern progressive, which means the ridge that forms over the West US as a result (the positive PNA indicator) will likely drift east and spread warmer weather east.

To Summarize:

- A brief flip to colder weather is expected next week, mainly between a January 10-15 period.
- Warmer weather is expected to return after January 15th.

Andrew

Monday, January 4, 2016

January 9-12 Potential Winter Storm

There appears to be the risk for a storm system to impact the East US, particularly the Northeast, in the January 9-12 timeframe.

Tropical Tidbits
We'll first go over the forecast of the storm, and then get into it at a more analytical level. This forecast panel shows the 18z GFS forecast of precipitation type and intensity, as well as mean sea level pressure contours and 1000-500mb thickness values for the early morning of January 11th. We see a strong storm system just offshore the Northeast, producing widespread moderate to heavy rain right along the coast from New Jersey on northeastward, with light snow located in inland New York into east Pennsylvania. This solution could give copious amounts of rain and/or snow to the East Coast.

As expected, the internet is biting hard on this storm, given it could be the first real wintry system for the East this winter. Not to burst anyone's bubble, but below explains why I'm not expecting a real snow threat with this storm, and why not to bite on any forecasts yet.

Tropical Tidbits
This graphic shows us the 500-millibar vorticity values, forecasted for 12z (6 AM CST) today, Monday. That red box, all the way out near the Aleutian Islands, encompasses our storm system. That's right, the system that people are looking at is currently hundreds of miles away, closer to Russia than mainland United States. That's the first sign that we shouldn't take any model guidance at face value right now. Heck, the latest 00z GFS run came in and showed the storm pushing well out to sea, not even affecting most of the East US. I just chose to show that 18z GFS graphic so I could show what I'm talking about, and to make a few points, like this one.

Additionally, check out all the pieces of energy out ahead of our main system. If you count closely, just looking at this graphic, I can identify at least three separate storm systems downstream of our system of interest near the Aleutian Islands. Three systems is a lot for model guidance to sort out, and it doesn't help that one of those systems is also well out at sea, not even close to the radiosonde network which would help model accuracy. In sum, models are going to suffer a lot with this storm, both with the distance the storm is from the U.S., and how many systems are downstream of our storm itself.

Tropical Tidbits
This next point is specifically for the snow enthusiasts in the Northeast already getting excited for this storm. This is the 850-millibar temperature forecast for the morning of January 9th. At this point in time, our system is located somewhere in the South Plains, though it is not well-shown on this map. That's alright though, because we're looking at this image for the temperature spread across the Central and East US. All colors green and warmer are temperatures above freezing at this layer of the atmosphere (about 5,000 feet off the ground). That means that most areas east of the Mississippi River, save for Maine, Vermont, and New Hampshire, should be comfortably above freezing in the couple of days, even several hours prior to the storm actually beginning to impact the East (if it does at all).

For a good snow set-up, no matter where you may live, you want an established cold air mass before the storm begins. We saw that guideline in play with our last storm system, which dumped copious amounts of snow in the Plains into Iowa and Wisconsin, even laying down a few inches of sleet near Chicagoland. It was all that sleet and freezing rain that fell because there was no antecedent cold air mass. This go-around, we also will be lacking a pre-established cold air mass, and that really concerns me with snow prospects.

CPC
While I'm not set on the idea of a snowstorm, I am open to the concept of this actually being a storm for the Northeast. The North Atlantic Oscillation (NAO) will be negative when this storm occurs, albeit only slightly negative. This should encourage the storm to curve up the coast, though just how much 'encouragement' there is remains in question. It's completely plausible the storm goes straight out to sea, as the 00z GFS portrayed, and it's also possible it curves up the coast. I'm not confident in it going one way or the other right now, but both solutions are plausible.

To Summarize:

- There is the chance for a wintry storm system in the Northeast between the January 9-12 timeframe.
- Personally, I see a very realistic chance that this storm produces more rain than snow as a result of no antecedent cold air mass.
- Model guidance should not be trusted this far out.
- This storm could plausibly go out to sea rather than up the coast.

Andrew 

Sunday, December 20, 2015

Early Signals For Pattern Change in Early January

There are emerging signals for a change to a colder and snowier pattern in the early days of January 2016.

PSU
The image above shows the GFS Ensemble mean 500mb height anomaly forecast for hour 384- the infamous fantasy land, end of the run panel. The ensembles are expecting ridging to build up along the west coast of North America, with troughing taking over in the Bering Sea and Arctic Circle. This kind of pattern would likely promote an overall-cooler set-up than the one we're currently in, which will feature well above normal temperatures on Christmas Day.

You all know I wouldn't post a 384-hour graphic without good reason, so let's dive in.

CPC
The ensemble forecasts out of the Climate Prediction Center for the Pacific North American (PNA) index show a dip to negative values as we head to Christmas, but then rising to neutral, and even positive values to kick off 2016. The majority of members are in positive territory by the start of the new year. The relative consensus of most ensemble members on a neutral or positive value of the PNA is encouraging for winter weather fans. Positive PNA values typically result in colder and snowier weather for the Central and East US, while negative PNA values result in warmer weather.
Some of you may ask why it's been so warm even though the PNA was positive in December- that can be attributed to the El Nino, producing enhanced convection in a part of the Equatorial Pacific conducive for warm weather here in the U.S., however that's a topic for another post.

ESRL
A grand overview of four key teleconnections reveals this improving pattern (improving, at least in the eyes of winter weather fans). We see a continued positive EPO through the forecast timeframe- if you're more knowledgeable, you'll recall that the positive phase of the East Pacific Oscillation (EPO) encourages colder weather in the eastern 2/3rds of the country, while the negative phase encourages warmth. The WPO (West Pacific Oscillation) closely follows those guidelines as well.
As noted earlier, we see the forecasted PNA rising to at least neutral values in the long range near the start of 2016.

If all of these forecasted indices and teleconnections verify on an as-is basis (which, I may add, is rather unlikely), we could expect a cooler pattern in the Central and East US. This would be mitigated by the positive phases of the Arctic Oscillation (shown in the first image by negative height anomalies across the Arctic Circle) and North Atlantic Oscillation (shown in the first image by weak troughing over Greenland), both of which tend to discourage persistence of colder weather.

To summarize:

- There are indications that a pattern change may be on the way for the start of 2016.
- Model guidance will change drastically, and this is nowhere near set in stone. However, if this does verify to a certain degree, a cooler pattern may be on the horizon.

Andrew

Stratospheric Polar Vortex Expected to Weaken in January

The stratospheric polar vortex is expected to exhibit weakening in the near future.

Garfinkel/Hartmann Publication
(Image obtained from Eric Webb)
The above image, from the Garfinkel / Hartmann publication, 'Tropospheric Precursors of Anomalous Northern Hemisphere Stratospheric Polar Vortices', shows precursors in the tropospheric mid-levels to weakening of the stratospheric polar vortex. In layman's terms, the images above (particularly the left panel) give us a glimpse at what the weather pattern should look like a short period of time before the stratospheric polar vortex weakens.

In that left panel, showing geopotential height anomalies at the 500-millibar level, we see strong negative anomalies (troughs / storm systems) in the Bering Sea extending into the Arctic Circle, even a bit into Greenland, and positive anomalies (ridges / high pressure) over Canada, as well as in the north-central Pacific. We also see ridging over Europe. These are indicators that the stratospheric polar vortex could be weakening down the road.

Let's compare these indicators to the long-range forecast from the GFS Ensembles.

Tropical Tidbits
Attached is the 500-millibar height anomaly prognostication for the 11-15 day forecast period (Dec. 30 to Jan. 4). Here, we see negative anomalies across the Bering Sea into Siberia, all the way across the Arctic Circle into Greenland. We also see weak ridging in Canada and the East US, and ridging in the north-central Pacific. Most notable is a strong ridge over Europe.

If you compare this forecast graphic and that left panel earlier in this post, you'll find that they're incredibly similar, almost identical. In sum, long range model guidance is telling us that we should see the stratospheric polar vortex weaken in January. This is good news for snow and cold fans who have been suffering through this first month of 'winter' (more like an extended fall with these warm temperatures)- even though a weakened polar vortex does not necessarily mean cold and snow, it does raise the chances of more cold air intrusions and snow events for North America.

To summarize:

- Long range model guidance is indicating the stratospheric polar vortex will weaken in January.
- Consequentially, the chances of cold and snow may be on the rise for next month.

Andrew 

Thursday, November 26, 2015

Long Range Forecast (Posted 11/26/15)

This is the long range forecast, published on 11/26/15.


 The 500mb pattern over the last week showed a dominating ridge in the Gulf of Alaska, leading to negative geopotential height anomalies in central North America. This was exhibited by the strong storm system(s) that passed through the region since our last outlook.

 500-millibar chart shows a strong upper level low stationed over the Southwest, as the closed blue contours indicate. Southerly lower-level winds are advecting moisture northward into the Plains and Midwest, which will serve to kick off wintry weather on Thanksgiving.

 Polar water vapor imagery shows an active pattern in the North Hemisphere. We see two upper level lows with a Rossby Wave signature in the Gulf of Alaska, as well as another upper level low impacting the Aleutian Islands. Hurricane Sandra is shown near Mexico, and this will deliver moisture to the US later on.

 Analysis of the jet stream shows how the upper level low to the southwest of the Gulf of Alaska will likely be cut off from the jet stream in the near future, while a strong jet streak plows into the Pacific Northwest. Another jet streak pressing northwest of Arizona to the southeast of the trough tells us the upper level low in the Southwest is preparing to eject eastward. We also see another jet streak ribbon exiting Japan, which should provide us with a storm opportunity about 7-10 days down the road.

 Current tropical forcing across the globe shows upper level divergence from the area east of Madagascar, as well as northeast of Australia. This forcing pattern in the central Pacific is typically favorable for warmer weather, although additional convection near Africa helps dilute its influence so forcing is not too useful in its current position.

 Expecting a re-amplification of the pattern over the next 7-10 days as we see increased storm chances. Watch for a moderation in temperatures over the next several days, as tropical forcing indicates the atmosphere will be favorable for generally warmer than normal weather.

Storm concerns … potential storm monitored for 12/2 – 12/6. Increased risk for stormier than normal pattern about 12/5 – 12/15, though confidence is low.

 Continuing with previous outlook, conditions do still look somewhat cooler and stormier around the Christmas timeframe. New Years Day and the first week of 2016 should see a departure from this cooler/wetter pattern back into more moderated temperatures.

The Next Long Range Outlook will be published on December 2nd, 2015 at 5:00 PM CDT.

Andrew