
The Southern Oscillation Index, a key indicator for the emergence of an El Nino or La Nina, continues to free-fall as our El Nino looks to finally come to the surface.
The image above shows a 30-day average of the SOI values from January 2012 to the present day. The Southern Oscillation Index is calculated by examining the pressure differences between Tahiti and Darwin, Australia. When values drop below -8, conditions are considered optimal for El Nino formation. Values above +8 are considered optimal for La Nina conditions.
As the chart shows, we had been seeing predominantly-positive anomalies this past spring and early summer, which is likely a reason why the the historic Kelvin Wave never brought about the Super El Nino so many (myself included) had discussed. However, beginning right around the start of July, we saw SOI values tank, and they've remained below zero for the entire period since. Values have gone both above and below the El Nino 'benchmark' of -8 since that time, but have remained below zero the entire time.
Due to potential copyright infringement concerns, I will refrain from posting a forecast of the SOI I came across yesterday. What it shows, however, is continued negative SOI values for the next few weeks, and possibly beyond.
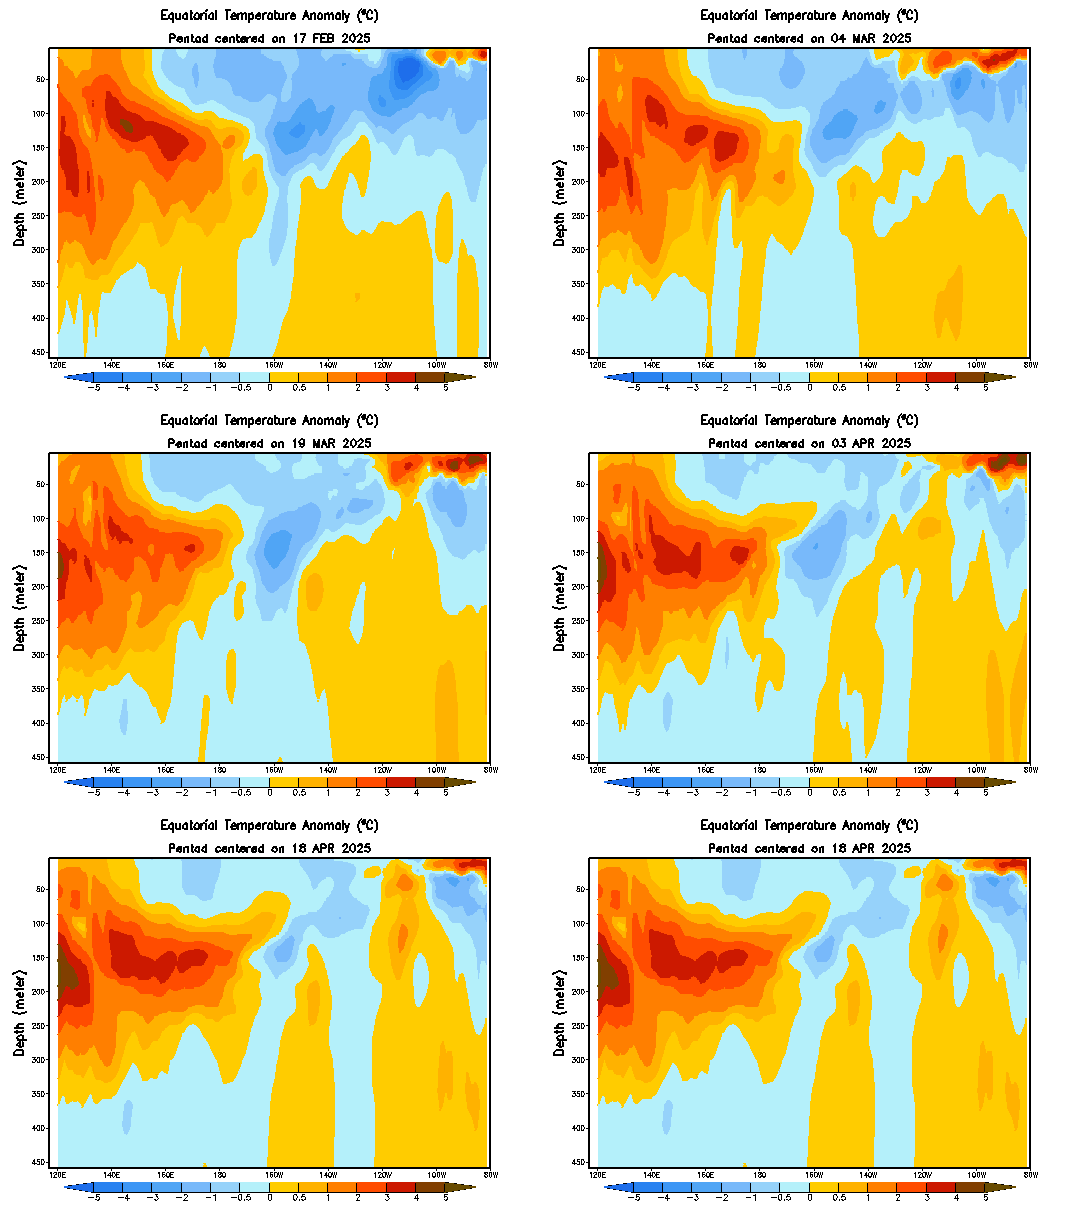
The animation above shows a depth-by-longitude animation of equatorial temperature anomalies, in Celsius, since mid-July to present day. In this animation, we see the Kelvin Wave-induced warm waters spreading east and pushing to the surface as they do so, now just beginning to hit the surface.
The SOI being negative indicates that trade winds along the Equator and areas in the neighborhood of the Central Pacific have shifted to a state that will allow this warmth to stay and ferment on the surface, likely into an El Nino. Back in April, with the historic Kelvin Wave warmth, trade winds wee unfavorable, and prohibited the warmth from sustaining itself on the surface.
In coming days and weeks, we'll likely see this winter's El Nino bring itself to the surface, likely at a weak, potentially moderate strength. I'll have more on the projected El Nino strength in the near future.
Andrew
 |
| BOM |
As the chart shows, we had been seeing predominantly-positive anomalies this past spring and early summer, which is likely a reason why the the historic Kelvin Wave never brought about the Super El Nino so many (myself included) had discussed. However, beginning right around the start of July, we saw SOI values tank, and they've remained below zero for the entire period since. Values have gone both above and below the El Nino 'benchmark' of -8 since that time, but have remained below zero the entire time.
Due to potential copyright infringement concerns, I will refrain from posting a forecast of the SOI I came across yesterday. What it shows, however, is continued negative SOI values for the next few weeks, and possibly beyond.
 |
| CPC |
The SOI being negative indicates that trade winds along the Equator and areas in the neighborhood of the Central Pacific have shifted to a state that will allow this warmth to stay and ferment on the surface, likely into an El Nino. Back in April, with the historic Kelvin Wave warmth, trade winds wee unfavorable, and prohibited the warmth from sustaining itself on the surface.
In coming days and weeks, we'll likely see this winter's El Nino bring itself to the surface, likely at a weak, potentially moderate strength. I'll have more on the projected El Nino strength in the near future.
Andrew


.png)


