Showing posts with label March 2015. Show all posts

Sunday, March 22, 2015

March 24, 2015 Severe Weather Outlook

The Storm Prediction Center has issued a severe weather outlook for March 24th, 2015.

SPC
The Storm Prediction Center is expecting potential severe weather to develop in much of Missouri, northeast Oklahoma, northwest Arkansas, eastern Kansas, southern Iowa, and extreme western Illinois. The current risk is listed as a Slight Risk, which is not a significant threat outlook, but should be monitored.

Analysis
WPC forecast, valid Wednesday, March 24th
The severe weather set-up will include a strong low pressure system moving into the Upper Midwest. A warm front well displaced from the severe weather outlook area (shown in Michigan and Ohio above) will allow for a narrow corridor of potentially severe weather to develop. These storms should develop along the cold front that will shift eastward through the area. But is this risk actually legitimate?

COD
The above image shows projected radar reflectivity at 7 AM Central Time on Tuesday. We see a large complex of showers and thunderstorms moving across the corridor highlighted for severe weather on this day. This ongoing complex likely will hinder any severe weather prospects for later on in the day, which would end up ruining this severe weather chance. The best risk for severe weather is likely with that morning's band of showers and storms, portrayed in Missouri and southern Iowa on this NAM model forecast.

To summarize:

- Missouri, Iowa, Illinois, and Oklahoma are at risk for severe weather on March 24, 2015.
- This severe weather potential could be ruined by ongoing showers and storms early in the morning.

Andrew

Wednesday, March 18, 2015

Warmer Weather Returns After Early April Cold Blast

It looks as if warm weather will make a comeback after a stark cold shot hits to close March and open April.

Tropical Tidbits
In the image above, we see 500mb geopotential heights over the West Pacific, where reds indicate above normal values typically associated with high pressure and calm weather. Blues indicate toughing, symptomatic of colder and stormier weather on the surface. In this chart, valid on March 27th, we can see the strong ridge over Japan and areas just off to the north, with a slight trough to the south.

Using this, we can predict what the first week or so of April will be like. The Typhoon Rule tells us we can expect weather phenomena in Japan to 'happen again' here in the US about 6-10 days later. If the image above is valid on the 27th, we should expect some warmer weather around the first couple days of April. However, it's very possible this warmth is actually delayed, due to the aforementioned cold weather hitting the country at the end of March and start of April.

To summarize:

- After cold weather hitting in late March into the first couple days of April, warmer weather should make a comeback.

Andrew 

Sunday, March 15, 2015

Wintry Blast Expected to Close March, Open April

After a warmer ending to March, it is expected that a cold air mass will deliver one of the last punches of wintry weather to the country.

Tropical Tidbits
The image above shows 500mb geopotential height anomalies across the West Pacific. This forecast comes off the GFS model, valid for Wednesday, March 18th. We see a strong ridge located over Japan in this image, likely a result of the deep toughing further east in the North Pacific, as well as some more activity further west. When we apply the Typhoon Rule, stating that weather events occurring over Japan will 'come back' and 're-appear' in the US 6-10 days later, we could expect a generally warmer pattern persisting through about March 26th-ish, probably a bit longer.

Tropical Tidbits
The picture becomes much more ominous by March 23rd. By that time, the GFS model expects a rather large upper level low to drop into Japan, as shown by the deep negative anomalies over the island nation. In a nutshell, this means very cold weather is expected about 6-10 days later, likely in the very final days of March and the first week or so of April. If this happened in the middle of winter, we would likely be looking at record-breaking cold. However, due to the significant loss of snow-cover as of late, as well as climatological numbers telling us how quickly our average high and low temperatures are rising, this will likely be more of a strong cold blast, as opposed to a deep freeze.

To summarize:

- Predominantly warm weather is expected to persist through the end of March.
- The last few days of March and first week of April could see a shot of rather strong cold weather.

Andrew

Wednesday, March 11, 2015

Colder, Stormier Weather Returns for Late March

Model guidance is indicating we're likely to see another stormy and cool period to end March.

Tropical Tidbits
The image above shows 500mb geopotential height anomalies over the West Pacific and eastern Asia. In this chart, oranges depict ridging aloft, a signal for warmer and generally quiet weather. Similarly blues depict toughing/storminess, and thus brings about cooler weather. In the graphic above, we see a persistent trough sitting over Japan and the Koreas, as signified by the plethora of blues. This is actually a mess of storm systems and cool weather combined.

When we apply the Typhoon Rule, which states weather phenomena occurring in Japan is reciprocated here in the US about 6-10 days later, we should expect a generally stormy and cool pattern around March 18-24 or so. This includes a stormy end to spring break for those who vacation next week, and a similarly cool/wet pattern for those who begin their vacations the week after next.

Tropical Tidbits
Models are already honing in on that colder weather. The above graphic again shows 500mb geopotential height anomalies, but this time over the United States and valid on March 18th. Here, we see prevalent ridging over the western half of the country, leading to pleasant conditions in the Rockies and Plains. However, a deep upper level low is forecast to traverse the Northeast and southern Canada, as the deep blues show. This means cold weather, possibly bringing about snowfall in the process for some.

To summarize:

- A generally stormy and cool pattern is expected for the second-to-last week or so of March, primarily around March 18-24.

Andrew

Monday, March 9, 2015

March 9-11 Severe Weather Potential

The Storm Prediction Center has highlighted portions of the Gulf Coast for a severe weather threat.

SPC
Today's severe weather threat is focused in southeastern Louisiana and extreme southern Mississippi, where a Marginal risk of severe weather has been posted. Radar imagery shows a broad swath of moderate to heavy precipitation across the south-central Plains, feeding on moisture from the Gulf of Mexico. Thunderstorms appear to be moving inland over the Marginal risk area, and it looks as though the main threats will be tornadoes and wind.

SPC
Tomorrow's severe weather threat, for March 10th, is more expansive than today's. We see a Marginal risk of severe weather across eastern Louisiana, southern and central Mississippi, and southwestern Alabama. A general risk of thunderstorms surrounds this more elevated threat delineation. A similar set-up to today should evolve over the central Gulf Coast, as that rich Gulf of Mexico moisture continues to allow for thunderstorms to flow onshore, possibly even training in some spots to lay down heavier totals than forecast.

Andrew

Wednesday, March 4, 2015

Long Range Outlook for March, Early April 2015

This is the Long Range Outlook for the period of March 2015 into early April 2015.

Paul Roundy
The above image is pretty complicated, but bear with me and it won't be so bad. This chart shows a longitude-by-time forecast for tropical convection anomalies (colored shadings) between 7.5º North and 7.5º South latitude, centered on the Equator. Blue colors correspond to enhanced tropical convection (thunderstorms), while yellows are indicative of suppressed convection. There are a lot of lines here, but the only ones we need to worry about are the red lines, which show the active phase of the Madden-Julian Oscillation in solid (dashed is the suppressed 'phase'), as well as the Kelvin Wave, which is in thin pink.

We currently see an MJO wave evolving from about 75 degrees East, as the red lines in that longitudinal sector show. It is expected that this wave will strengthen in the next week or two as an Equatorial Rossby Wave moves over the region, shown as a light-green delineation. The placement of tropical convection in this part of the world is equivalent to a Phase 4 MJO event. As shown in the image below, temperatures during a Phase 4 event will tend to lean warmer than normal for much of the country, but a deep snowpack across much of the North and Central parts of the US tells me this warm-up could very well be muted around March 12th.

CPC
A Kelvin Wave then forms around that March 12th period, and this convectively-coupled Kelvin Wave traverses the Pacific in time for the final days of the month. This very progressive tropical forcing theme tells me the country is likely in for some roller coaster weather patterns for the remainder of the month, despite the MJO wave signal only shifting eastward slowly in contrast to the Kelvin Wave movement. This particular chart has us reaching Phase 5 of the Madden-Julian Oscillation by the final days of March, which would typically favor a cooler than normal pattern for the Northern US.

However, this cold outlook for the end of March is working in contrast to a projected pattern shift in the Pacific, in which ensemble guidance sees a trough positioning itself along the west coast of North America to permit warmer weather in the Central and East US. With warm signals coming from the Typhoon Rule as Japan undergoes a generally-warm pattern in the next two weeks-plus, and tropical forcing not really being effective this past month due to such dominance from the Pacific pattern, I'll opt for a warmer outlook to close March.

To summarize:

- An overall cool pattern should remain in place through about mid-March.
- Model guidance is then indicating, at the very least, the synoptic (overall) weather pattern will undergo some changes for the last half of March. I see this as being a good shot for a warmer pattern.
- This warmer pattern could continue into early April.

Andrew

Tuesday, March 3, 2015

March 4-5 Potential Ice Storm

There is an increasing likelihood that accumulating ice will pose a threat to residents in the Southern US.

PSU
High resolution precipitation-type forecasts show rain impacting the states of Mississippi, Georgia, and Alabama into the Carolinas late on March 4th into the 5th, before widespread icing begins to take hold. Areas affected include northern Mississippi, northern Alabama, central Tennessee, eastern Kentucky, and portions of the Mid-Atlantic. Snowfall may then be expected to the north.

WxCaster
Ice accumulations from the GFS model lay down pockets of close to 0.50" in portions of Arkansas and Tennessee, as well as Texas and Louisiana. Model guidance usually doesn't do well with freezing rain forecasts, but amounts over 0.10" are very possible, if not likely, in northern Mississippi into Tennessee.

To summarize:

- An ice storm may impact the South US on March 4th and 5th.
- Accumulations could reach as high as 0.25" of ice in many areas, with isolated higher amounts.

Andrew

Friday, February 27, 2015

Long Range Ensembles Predict Incoming Spring-Like Weather

Long range ensembles are indicating a much warmer weather pattern is on the way for much of the country that has been held hostage by brutal cold in the last month.

PSU
Click to enlarge
The above image shows 500mb geopotential height anomalies from the GFS ensembles, projected over the Northern Hemisphere and valid for March 1st. In this graphic, we see a massive ridge of high pressure, the same one which has allowed for such a cold and snowy February, meandering westward over the north-central Pacific, as opposed to the northeast Pacific and Gulf of Alaska. This comes as a strong trough drops into the Southwest and Baja California. In response, with the strong upper level low previously positioned over Greenland, now over Europe, a ridge is able to form over the Central and East US. It looks like this ridge will be suppressed a bit, but warmer weather is on the way for those in the Plains, Midwest, Ohio Valley, and Northeast, among other areas.

PSU
By March 7th, ensembles are indicating the ridge remains in the north-central Pacific, but an upper level low has now developed in the Gulf of Alaska. Unfortunately, this then results in a ridge forming over the Western US, as the graphic above shows. Consequentially, the semi-permanent Arctic long wave trough (better than using 'polar vortex', apparently) is being pushed back into North America, setting up another period of cold weather for the Central and East US. This would likely last for a handful of days, right between February 5-10 or so.

But... finally... finally!... relief comes.

PSU
In the long-long range, to March 11th, ensembles see our ridge forcing itself north in the north Pacific into the Aleutian Islands, along the jet stream, where the "polar vortex" is stationed just off to the north. The net result for us is another trough setting up over the western section of North America. You weather enthusiasts know this as a negative Pacific-North American (PNA) pattern, with a trough in the west and warmth in the East.

This looks to be our new pattern, going strictly by these ensembles. Stormy weather in the West with predominantly warm weather out east.

To summarize:

- A brief warm-up is expected in the final days of February and early days of March.
- Another cold blast can be expected around March 7th.
- The pattern may then shift to a warmer set-up for the middle half of March.

Andrew 

Wednesday, February 25, 2015

March 1-2 Potential Winter Storm

Model guidance has been indicating a winter storm will track across the middle of the country, bringing accumulating snow to those further south of where much of the wintry weather has occurred this winter.

Tropical Tidbits
The image above shows the GFS forecast for precipitation type and intensity, valid for Sunday night. We see light to moderate, possibly even heavy snow falling across the Midwest, Great Lakes, and Ohio Valley. A classic signal of winter finally on its way out, the rain/snow line is displaced pretty far north in comparison to where it has been in recent days and weeks, with rain being a concern in southern Illinois into southern Ohio. A bit of mixed precipitation could impact those in the central Plains.

Instant Weather Maps
Snowfall projections have been waving back and forth with the axis of heaviest accumulations, but the latest GFS pegs a swath of 6-10" accumulations across the central Plains into the Midwest and central Great Lakes, with Kansas, northern Missouri, central Illinois and northern Indiana receiving the most snow.

To summarize:

- Model guidance is anticipating a winter storm to affect the country over the next few days.
- Snowfall on the order of 6-10" may be expected.
- While the track of this storm is still not nailed down yet, the central Plains and Midwest ought to see the most intense snow accumulations.

Andrew 

Thursday, February 12, 2015

Long Range Outlook (Made February 12, 2015)

This is the Long Range Outlook, valid for the middle and end of February into the start of March.

PSU
Ensemble guidance close to 9 days out from today shows a pattern highly conducive to cold weather across North America. We see a strong ridge positioned across the west coast of North America, pushing into Alaska. The alignment of this ridge closer into the Gulf of Alaska as opposed to along the shoreline indicates a negative East Pacific Oscillation (EPO) pattern. This sort of pattern allows for sustained northwest flow (winds out of the northwest) in the Central US, and this is well shown by the strong upper level low buckling south into the Great Lakes. Short range projections show very cold temperatures slamming much of the nation, hitting the northern Ohio Valley and Northeast very hard in particular. This cold pattern looks to be enhanced by some ridging, albeit suppressed, south of Greenland. I am concerned that the ridge not being positioned closer to Greenland could make this cold weather more progressive and not as long-lasting as current ensembles are making it out to be, though those details can be sorted out further down the road. For now, the opening days of this 7-31 day forecast period are looking very cold.

PSU
By Hour 348, which is about 14 days out from today, we see a shifting of the members mentioned above to the west. Our negative EPO ridge has now been shunted west, and now occupies the Bering Sea into waters to the southwest. The strong upper level low still remains on our side of the hemisphere, but the core of this low has been retracted into the North Atlantic, with a leg of negative height anomalies stretching out to the Rockies. As a result, the general idea is that more progressive flow can be expected as we round out February, which should be able to moderate any cold blasts near the end of the month. We also see ridging coming up offshore of the East Coast, which could put an end to what looks to be an incredibly cold and snowy February for millions in the East.

Albany
We now turn to tropical forcing to help us identify the pattern for the beginning days of March. Looking at the bottom panel, we see a significant swath of enhanced tropical convection blossoming just south and east of the subcontinent of India, depicted by the deep blue shadings. If we match the positioning of these anomalies to the eight phases of the Madden Julian Oscillation, we can expect the emergence of a Phase 3 or Phase 4 event, as the composite chart below shows.

BOM
Generally, Phase 3 events support cooler than normal temperatures in the United States, while Phase 4 composites indicate warmth prevails across the country. Purely due to how February looks to shape up, I would favor a chillier outlook to kick off March. This method of persistence forecasting tends to work well, particularly when the pattern seems to 'lock in' to a certain temperature alignment; in this case, a cold Central and East US, with warmth in the West.

CPC
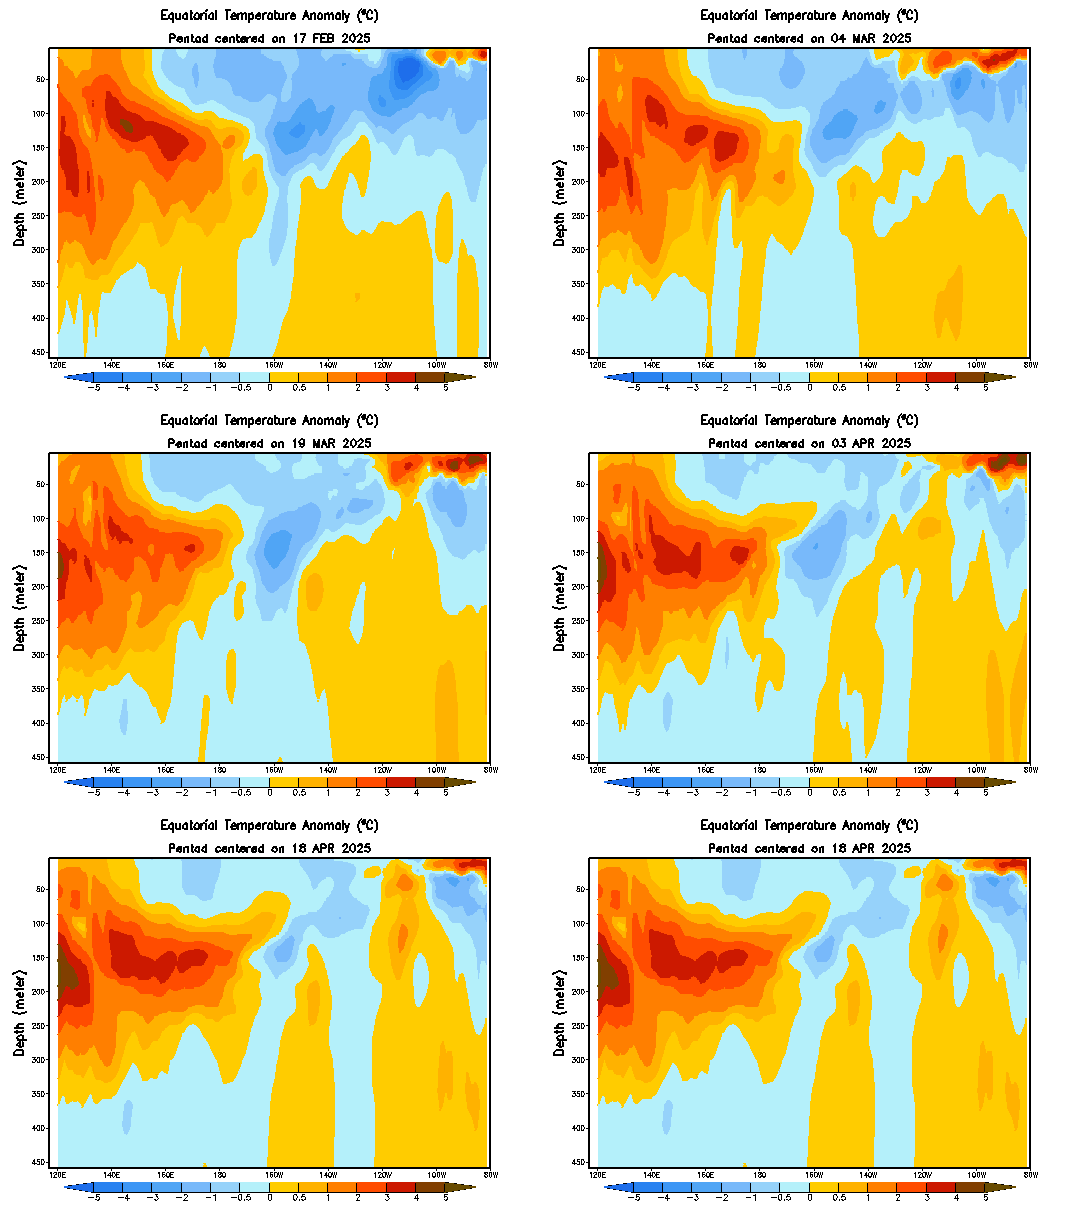
Looking even further out, just for kicks, let's go over sea surface temperature anomalies, under the surface. Anomalies show the 'warm part', the upwelling phase of a Kelvin wave moving eastward at a depth of about 100 to 200 meters. We're currently seeing the 'cold part' of that Kelvin wave, the downwelling phase, hitting the surface from about the 100 west longitude line on eastward. The warmth from the upwelling is already at the surface in the Central Pacific, and this could be setting up a more El Nino-like pattern. I personally find this to be plausible, as El Nino winters are notorious for a slow start and furious end, as we're seeing in real time right now in the East US.
In springs with an El Nino, temperatures in the North US will generally be warmer than normal, while the opposite scenario plays out in the South, with colder than normal temperatures. It remains to be seen if this will play out in the March-April-May period, but it'll be something to watch.

To summarize:

- A very cold pattern will unfold over the next 7-14 days.
- There are hints of a warmer pattern coming around for the period beyond 14 days, but this needs to be watched for potential failure.
- It is expected that the East will remain overall below normal throughout the entire period in temperatures. A similar story, though not as cold, may be expected in the Central US.
- Snowfall should favor the East US in this entire pattern, though a shift to a more inland track could occur in late February if model guidance ends up being correct.

Andrew