Showing posts with label GFS Ensembles. Show all posts

Sunday, June 9, 2019

Long Range Outlook (Made June 9, 2019)

This is a Long Range Outlook made for publication on June 9th. The forecast period will cover the remainder of June. Click on any image to enlarge it.

Observed 500-millibar geopotential height anomalies as of 1pm Central, June 8th.
Source: Tropical Tidbits
A look around the Northern Hemisphere on the afternoon of June 8th shows a rather-busy pattern over North America, with an upper level low positioned over northwest Canada and a secondary trough dropping into the Pacific Northwest while still being influenced by the first system. A strong ridge maximized over the northern Great Lakes into southern Canada contrasts with a closed low positioned in the Southeast U.S., forming a Rex Block-looking pattern despite there not being any actual blocking event taking place. Indeed, even downstream of this pattern into Newfoundland, the flow is rather amplified with an upper level low grinding against a strong ridge that is firmly entrenched into Greenland. Upstream of the United States, weak ridging is evident in the northeast Pacific, helping to diffuse the Pacific jet stream in the process. A strong storm system is seen south of the Aleutian Islands, with additional disturbed weather skirting along the northern Pacific.

Forecasted 500-millibar geopotential height anomalies valid 7am Central, June 12th.
Source: Tropical Tidbits
Even within the five-day forecast window, the evolution of the flow over the Northern Hemisphere becomes rather complex rather quickly. The ridge and closed low mentioned in the eastern half of North America are seen drifting eastward, with model guidance suggesting the ridge will propagate northeastward into Greenland to maximize positive 500mb height anomalies. Additionally, the observed weak ridging in the northeast Pacific is expected to strengthen and entrench itself across the western coast of the continent, thereby setting up a pattern representative of the positive phase of the Pacific-North American (PNA) oscillation, seen by ridging along the West Coast, as well as the negative phase of the North Atlantic Oscillation (NAO), seen by ridging over Greenland.

The result of these two features, as well as a messy picture for the West Pacific Oscillation and East Pacific Oscillation (EPO), is a likelihood of cooler than normal temperatures across the eastern two-thirds of the United States, as well as into Canada. The positive PNA and negative NAO will act to direct air from northern Canada down into the United States. Indeed, the five-day average 2-meters-above-the-surface temperature anomalies below, through the period ending June 14th, shows a substantial and widespread period of below-normal temperatures for the majority of the country.

Forecasted 5-day average ~surface temperature anomalies, valid through the period ending 1pm June 14th.
Source: Tropical Tidbits
Model guidance is showing strong confidence in the evolution of strong ridging over both western North America and Greenland as well:

NCEP Relative Measure of Predictability for 500-millibar values at forecast hour 96 (June 11th 7pm).
Source: NCEP
Given the high confidence in the projected pattern through the five-day forecast timeframe, it does appear that colder-than-normal temperatures are likely for the eastern two-thirds of the country through at least June 14th.

Forecasted 500-millibar geopotential height anomalies valid 7am Central, June 18th.
Source: Tropical Tidbits
Ensemble model guidance is in agreement that the strong ridge over Greenland (again, the negative-NAO pattern) will remain in place through at least the day 10 forecast period, as shown above by the ECMWF (European model) ensembles. Upstream of the contiguous United States, too, model guidance does not anticipate any significant changes in the aggregate pattern, with predictions of ridging continuing along the west coast of North America as an upper level low situates itself just south of Alaska.

Let's now turn to teleconnections and oscillations to ascertain if model guidance is correct in depicting the forecast into the end of June.

Forecasted states of the Pacific-North American (PNA) index, top-left; North Atlantic Oscillation (NAO), top-right; Western Pacific Oscillation (WPO), bottom-left; and the Eastern Pacific Oscillation (EPO), bottom-right.
Source: Earth System Research Laboratory (ESRL)
Viewing model-forecasted teleconnections over the next two weeks or so, we find a broad pattern similar to what was described earlier, with the positive PNA and negative NAO expected to dominate the outlook for North American weather throughout the forecast period. Guidance does weaken the PNA significantly from a strong-positive state to a slight-negative state by June 20th. I personally don't see this as remarkably likely when compared to a forecast that has the PNA remaining positive (even if modestly so) through the period, and I'll discuss why shortly.

As noted earlier, the WPO and EPO are not expected to be strong enough to materially disrupt the +PNA/-NAO combination, with the moderately-positive West Pacific Oscillation forecast actually a boon for helping to sustain the ridge along the western coast of North America, and thereby sustain the +PNA. Model guidance sees the EPO as hovering essentially around levels too weak to have a definitive impact on the weather pattern.

I'd like to briefly discuss a second reason - in addition to the expected positive WPO - why I believe the ridge along the western coast of North America (the +PNA) will sustain longer than guidance indicates here.
Madden-Julian Oscillation (MJO) phase space diagram forecast, from the ECMWF model.
Source: Climate Prediction Center and ensembles.

For a refresher on the concept of the Madden-Julian Oscillation and how to dissect a phase-space diagram, feel free to read this post from earlier. The European model and its ensembles anticipate the MJO staying in a low-grade Phase 3 state over the short-term, before shifting into Phase 4, strengthening somewhat, and then potentially weakening into the 'circle of death'. Given how model guidance in that linked post had expected us to be in the 'circle of death' at the time of this writing, rather than in Phase 3, we will only trust the forecast to take us from a low-grade Phase 3 to a low-grade Phase 4 through the end of June.

We are able to see how the atmosphere typically acts when the MJO is in Phase 4 for the month of June below.
500-millibar geopotential height anomalies when the MJO is in Phase 4 during the month of June.
Source: American Weather
When the MJO is in Phase 4 during the month of June, positive height anomalies tend to be favored over the Gulf of Alaska into parts of the Aleutian Islands, with another area of positive height anomalies over Greenland. Below-normal anomalies are then painted across a good swath of the eastern two-thirds of North America.

If you're thinking that this Phase 4 composite above looks remarkably similar to the forecasted pattern beginning around June 11th, as discussed earlier in this post, you aren't the only one. It doesn't seem coincidental to me that model guidance maintains the +PNA/-NAO pattern through much of the remainder of June, particularly since the MJO moving into Phase 4 would support exactly this kind of pattern to continue.
It is possible that guidance thinks the PNA will weaken and even reverse into a negative state by late June simply because the models are - correctly - trained to forecast the state of a teleconnection by comparing the forecasted pattern with a "textbook" pattern. For example, scientists have developed what the atmosphere should look like when the PNA is said to be positive, and thus models compare their forecast to that "ideal" pattern to determine what state the PNA will be in. However, the atmosphere is not binary like that - in other words, even though the PNA might be forecasted to be negative, the pattern itself may still resemble a positive PNA. Let's discuss this further.

Forecasted 500-millibar geopotential height anomalies valid 7am Central, June 21st, with annotations.
Source of image: Tropical Tidbits
Source of annotations: Author
Shown above is the 500-millibar height anomaly forecast from the GFS Ensembles, valid the morning of June 21st. This is the purported date by which the PNA is forecasted to turn negative, as per the four-panel graphic examined earlier in this article. Looking at the broad forecasted pattern, however, shows the pitfalls that simply taking the index forecast & going with it can present.

First, we recognize why guidance thinks the PNA will flip from strong-positive to a negative state: there is an expectation that troughing will develop along and off the coast of western North America, a part of which I have circled in red. To be sure, stormy activity in this region is indeed what a negative-PNA consists of, so the models are not at fault here. The issue we want to resolve is a lack of context that looking only at forecasts of the indexes results in.

When broadening out beyond the trough along the western coast of the continent, the ridge that is expected to send the PNA into strong positive territory is seen, now having retrograded slightly into the Gulf of Alaska. The movement of the ridge to the west is indeed why troughing is seen developing along the western coast. But take a look at the way the ridge extends into Alaska to see what I mean by 'lack of context'. Instead of merely topping off around Anchorage, the positive anomalies extend well into Alaska, and join up with another ridge based in Canada, the combination of which then pushes into the Arctic Circle. That doesn't mean much for the trough along the west coast of the continent, but it's certainly something we need to note, and here's why.

Take a look at Greenland again. The strong ridge is still forecasted to be positioned over Greenland, keeping the negative-NAO in place, as expected by the four-panel teleconnection graphic from above. Big deal, so what? So, the negative NAO pattern keeps colder than normal conditions in place over the Northeast U.S., Great Lakes and into the Mid-Atlantic. But with that strong ridge in Alaska and Canada, I find it more plausible that the lobe of colder weather will also affect the Midwest, parts of the Plains, and the Ohio Valley. Why? That ridge in western Canada will team up with the Greenland ridge to force the primary lobe of cold air to the south, as is already seen in the graphic above.

But it's the fact that the Gulf of Alaska ridge extends its influence into the Canadian ridge that makes me think those regions will also be affected by cold air. The alignment of the Gulf of Alaska ridge suggests it shouldn't be difficult at all for that ridge to push northeastward into Canada, where the other ridge is based. If/when this happens, the trough along the western coast of North America will be suppressed, and perhaps even displaced to the south towards the Southwest U.S., which could then allow the ridge to build back into the southwest part of Canada or even into the Pacific Northwest again.

All in all, that would allow a more positive-PNA-esque pattern to emerge (with respect to cold air hitting the mid-section of the country and not just the Northeast), even though by definition we should be in a neutral or even negative-PNA state, since that trough will still likely stick around, just a little farther south.

Whether this scenario actually plays out is something only time will tell, of course, but I wanted to emphasize this because when looking at teleconnection forecasts, you need to also know the *context*. I have gotten burned plenty of times by only going off the teleconnection forecasts (for example, only seeing a -NAO or +PNA and basing the forecast off that) and not understanding the context for that forecast (for example, the +PNA might not be as sturdy as the teleconnection forecast shows because of a strong upper level low just to the west of North America, or something along those lines).

---

All told, this provides a good basis for my outlook for the remainder of June.

- Through the middle of June, I expect colder than normal conditions to evolve for the eastern two-thirds of the country. This cooler weather will be widespread, with areas only west of the Front Range likely to see seasonal to above-normal temperatures. In terms of precipitation, any severe weather threats should stay confined to the southern portion of the country, with the jet stream and broader pattern alignment unfavorable for any severe weather outbreaks at this time.

- From the middle of June to the end of June, I expect a continuation of this cooler than normal pattern, though with a reprieve coming for the Plains and perhaps parts of the Midwest as a trough builds in to parts of western North America to return some parts of the central U.S. to more seasonal conditions. However, firmly cooler than normal conditions should persist for the eastern third of the country, especially in the Northeast. Any seasonal conditions will be pockmarked by cooler bouts of weather for those in the Midwest and Great Lakes into the Ohio Valley, though again the coldest conditions should stay further east. Storm chances should increase for the central part of the country with a return to more seasonal weather, but zonal flow aloft and the lack of a ridge in the Southeast should dissuade any significant severe threats from hitting the Central U.S., and likely from hitting the country in general.

Andrew

Monday, March 23, 2015

Long Range - Monthly Outlook: April 2015

This is the long range/Monthly outlook for late March into April 2015.

We'll first begin with a diagnosis of the atmosphere. For those who find the technical jargon a little overwhelming, summaries to the post are provided at the bottom of the page.

ESRL
The above image shows relative atmospheric angular momentum anomalies on the top panel, with the global anomaly on the bottom panel. According to the latest data, we are in a globally positive-AAM (+AAM) state, mainly due to a nice surge of +AAM to the equator. This has pushed the atmosphere into an El Nino mindset, which has shown up in our atmosphere. We'll go more in-depth to that later on.

ESRL
The graphic above shows the tendency anomalies of the atmospheric angular momentum on the top panel, with the net tendency on the bottom panel. Notice how we're currently recovering from a massive +AAM tendency spike, and are now in a net negative AAM tendency. The cause of this tendency is not the thing we will analyze; right now, we are noting that we're in a +AAM state with -AAM tendencies.
This fits well into the four stage descriptions of the Global Wind Oscillation (GWO), which takes those above graphics and makes them into useful data. Here's the descriptions of all four stages of the GWO; pay careful attention to the first and last sentences of each stage.

The four primary phases of the GWO are described below, along with generally cold season (November-March) probable weather impacts for the USA. The GWO recurrence interval, or "time it takes to make a circuit", ranges from a broad 15-80 days. Two of the stages project strongly on El Nino and La Nina circulation states, which are also characterized by positive (Stage 3) and negative (Stage 1) global AAM anomalies, respectively.  Stages 2 and 4 are transitional.

Stage 1 (La-Nina like) – the global relative AAM anomaly is negative. The negative anomaly is primarily due to easterly upper level wind anomalies that extend from the Eastern Hemisphere tropics to the Western Hemisphere mid-latitudes. A retracted Pacific Ocean jet stream is a key feature in the total field.  Troughs are probable across the western USA with a ridge over the southeast.  High impact weather is favored across the Plains.

Stage 2 – the global relative AAM tendency is positive. This means that negative AAM is being removed from the atmosphere by surface friction and mountains. At the same time, westerly wind anomalies are intensifying in equatorial regions of the Western Hemisphere. Fast Rossby wave dispersion events in both hemispheres are a coherent feature of this stage and Stage 4.  A cold regime is probable across the central USA.

Stage 3 (El-Nino like) – the global relative AAM anomaly is positive. Westerly wind anomalies move into the Eastern Hemisphere, broaden in latitudinal extent and link up with deep westerly flow anomalies over the mid-latitude Western Hemisphere. An extended Pacific Ocean jet stream and southward shifted storm track is observed  favoring high impact weather events along the USA west coast.

Stage 4 – the global relative AAM tendency is negative. Positive (westerly) AAM anomalies are being removed by surface friction in the Western Hemisphere mid-latitudes and through mountain torques across the Northern Hemisphere topography. The next phase of the oscillation (if there is one) is represented by easterly wind anomalies intensifying over equatorial regions of the Western Hemisphere. This stage has enhanced subtropical jets and closed lows in the subtropics favoring rainfall events over the southwestern USA.
What did you notice in each stage description? Did you notice how each description began with details on how the net (global relative) AAM or AAM tendency was positive or negative? Let's apply that here.
We saw earlier how we are in a +AAM / -AAM tendency phase right now. Using those particular sentences in each description, it appears we're in Stage 3 or Stage 4 of the Global Wind Oscillation. Let's investigate each description closer. In Stage 3, among other details, the Pacific jet stream is extended (can stretch across the Pacific), and active weather impacts the West US. In Stage 4, the subtropical jet stream is strengthened, and closed lows in the subtropics can permit heavy rainfall over the Southwest.

Do we have any of those factors?

CPC
The answer is yes. The graphic above shows 200 hPa heights and wind speeds in ~4 day periods, with the least recent panel in the top left and the most recent panel in the bottom left. Notice how the Pacific jet stream is clearly extended into the North Pacific, fulfilling our Stage 3 ideals. If you'll look back at the stage description for Stage 3, you'll notice how it says 'El-Nino Like'. This means that conditions in this stage are most likely to provoke an El Nino-like response in the atmosphere. We're already seeing that response, namely in the extended Pacific jet and the AAM charts. I expect this to continue throughout April due to ensemble agreement.

PSU
The temperature anomaly charts in the US came back very cold for the next week or so. Each individual member is shown on those smaller boxes, while the large box contains the mean temperature departure. There is very good agreement on this cold, as well, valid on March 28th.

MJO
Lastly, let's go over the tropics. We're currently seeing a very strong tropical forcing episode over Phase 8 of the Madden-Julian Oscillation, a signal that has been created thanks to a powerful convectively coupled Kelvin Wave (CCKW). The long range ECMWF ensembles believe we see this current wave dissipate before we dip back into the circle of the unknown, and this proposal is backed up by the GFS model. This renders tropical forcing useful until just about March 28th, before the wave weakens into the Circle of Death on the MJO chart. Phase 8 and Phase 1 events in this time of year routinely create warm and cold conditions, respectively, in the Midwest, Central US, and East US. I have a good feeling that the Phase 8 activity will far outpace the Phase 1 activity, keeping us in the El Nino mindset well into April.

To summarize the forecast:

- The last days of March (24-30) may see sustained cooler than average temperatures. This may persist even longer in the Northeast.
- Early April will see continued threats to the West for heavy rainfall and moisture. A warm-up is expected for this time period.
- Mid and Late April can expect more El Nino conditions, with warm weather in the Morth and stormy/cool weather in the South.

Andrew


Wednesday, March 11, 2015

Colder, Stormier Weather Returns for Late March

Model guidance is indicating we're likely to see another stormy and cool period to end March.

Tropical Tidbits
The image above shows 500mb geopotential height anomalies over the West Pacific and eastern Asia. In this chart, oranges depict ridging aloft, a signal for warmer and generally quiet weather. Similarly blues depict toughing/storminess, and thus brings about cooler weather. In the graphic above, we see a persistent trough sitting over Japan and the Koreas, as signified by the plethora of blues. This is actually a mess of storm systems and cool weather combined.

When we apply the Typhoon Rule, which states weather phenomena occurring in Japan is reciprocated here in the US about 6-10 days later, we should expect a generally stormy and cool pattern around March 18-24 or so. This includes a stormy end to spring break for those who vacation next week, and a similarly cool/wet pattern for those who begin their vacations the week after next.

Tropical Tidbits
Models are already honing in on that colder weather. The above graphic again shows 500mb geopotential height anomalies, but this time over the United States and valid on March 18th. Here, we see prevalent ridging over the western half of the country, leading to pleasant conditions in the Rockies and Plains. However, a deep upper level low is forecast to traverse the Northeast and southern Canada, as the deep blues show. This means cold weather, possibly bringing about snowfall in the process for some.

To summarize:

- A generally stormy and cool pattern is expected for the second-to-last week or so of March, primarily around March 18-24.

Andrew

Friday, February 27, 2015

Long Range Ensembles Predict Incoming Spring-Like Weather

Long range ensembles are indicating a much warmer weather pattern is on the way for much of the country that has been held hostage by brutal cold in the last month.

PSU
Click to enlarge
The above image shows 500mb geopotential height anomalies from the GFS ensembles, projected over the Northern Hemisphere and valid for March 1st. In this graphic, we see a massive ridge of high pressure, the same one which has allowed for such a cold and snowy February, meandering westward over the north-central Pacific, as opposed to the northeast Pacific and Gulf of Alaska. This comes as a strong trough drops into the Southwest and Baja California. In response, with the strong upper level low previously positioned over Greenland, now over Europe, a ridge is able to form over the Central and East US. It looks like this ridge will be suppressed a bit, but warmer weather is on the way for those in the Plains, Midwest, Ohio Valley, and Northeast, among other areas.

PSU
By March 7th, ensembles are indicating the ridge remains in the north-central Pacific, but an upper level low has now developed in the Gulf of Alaska. Unfortunately, this then results in a ridge forming over the Western US, as the graphic above shows. Consequentially, the semi-permanent Arctic long wave trough (better than using 'polar vortex', apparently) is being pushed back into North America, setting up another period of cold weather for the Central and East US. This would likely last for a handful of days, right between February 5-10 or so.

But... finally... finally!... relief comes.

PSU
In the long-long range, to March 11th, ensembles see our ridge forcing itself north in the north Pacific into the Aleutian Islands, along the jet stream, where the "polar vortex" is stationed just off to the north. The net result for us is another trough setting up over the western section of North America. You weather enthusiasts know this as a negative Pacific-North American (PNA) pattern, with a trough in the west and warmth in the East.

This looks to be our new pattern, going strictly by these ensembles. Stormy weather in the West with predominantly warm weather out east.

To summarize:

- A brief warm-up is expected in the final days of February and early days of March.
- Another cold blast can be expected around March 7th.
- The pattern may then shift to a warmer set-up for the middle half of March.

Andrew 

Thursday, February 12, 2015

Anomalous Upper Level Low to Deliver Intense Cold in East US

An anomalous upper level low connected to the swirling mass of cold air in the Arctic looks to deliver a punch of brutally-cold air, impacting the East US the strongest.

PSU
Click images to enlarge
The above image shows the GFS ensemble mean spread forecast for the 500-millibar field on the top panel, with increased spread/uncertainty among ensemble members shown by shaded colors. That spread can also be seen in the individual member colored lines. The bottom panel shows anomalies for the 500-millibar field, with cool colors indicating negative anomalies, and warm colors depicting positive anomalies.

In this image, we note a strong upper level feature pushing south from Canada, with anomaly values reading 3.27 units below normal, maximized in western New York into western Pennsylvania as the purple colors show. Judging by the numerical denotations on that bottom panel, 500-millibar values could flirt with the 500-dm benchmark along the US/Canada border, indicative of a very strong (and very cold) upper level low.

Tropical Tidbits
Forecasts from computer models suggest sub-zero temperatures will be the theme throughout a significant swath of the North US. Latest guidance suggests temperatures in west New York and Pennsylvania will easily drop below -10 degrees Fahrenheit, with some locations getting very close to -20 degrees F. Locations further to the west, particularly in the Midwest and Great Lakes, may also come close to -15 degrees, with some areas dropping down to that -20 degree F benchmark. All in all, this is looking dangerously cold, potentially life-threatening.

To summarize:

- The first part of a multi-wave cold blast looks to impact the North US this weekend.
- Cold weather will be maximized in the Northeast, where temperatures could reach lows of -20 degrees Fahrenheit.
- Travel is strongly advised against due to the life-threatening nature of this cold air.
- Make sure to seek out assistance now for neighbors, friends, and/or family that may have trouble sustaining heat in their homes, or could be adversely affected by this cold.

Andrew

Long Range Outlook (Made February 12, 2015)

This is the Long Range Outlook, valid for the middle and end of February into the start of March.

PSU
Ensemble guidance close to 9 days out from today shows a pattern highly conducive to cold weather across North America. We see a strong ridge positioned across the west coast of North America, pushing into Alaska. The alignment of this ridge closer into the Gulf of Alaska as opposed to along the shoreline indicates a negative East Pacific Oscillation (EPO) pattern. This sort of pattern allows for sustained northwest flow (winds out of the northwest) in the Central US, and this is well shown by the strong upper level low buckling south into the Great Lakes. Short range projections show very cold temperatures slamming much of the nation, hitting the northern Ohio Valley and Northeast very hard in particular. This cold pattern looks to be enhanced by some ridging, albeit suppressed, south of Greenland. I am concerned that the ridge not being positioned closer to Greenland could make this cold weather more progressive and not as long-lasting as current ensembles are making it out to be, though those details can be sorted out further down the road. For now, the opening days of this 7-31 day forecast period are looking very cold.

PSU
By Hour 348, which is about 14 days out from today, we see a shifting of the members mentioned above to the west. Our negative EPO ridge has now been shunted west, and now occupies the Bering Sea into waters to the southwest. The strong upper level low still remains on our side of the hemisphere, but the core of this low has been retracted into the North Atlantic, with a leg of negative height anomalies stretching out to the Rockies. As a result, the general idea is that more progressive flow can be expected as we round out February, which should be able to moderate any cold blasts near the end of the month. We also see ridging coming up offshore of the East Coast, which could put an end to what looks to be an incredibly cold and snowy February for millions in the East.

Albany
We now turn to tropical forcing to help us identify the pattern for the beginning days of March. Looking at the bottom panel, we see a significant swath of enhanced tropical convection blossoming just south and east of the subcontinent of India, depicted by the deep blue shadings. If we match the positioning of these anomalies to the eight phases of the Madden Julian Oscillation, we can expect the emergence of a Phase 3 or Phase 4 event, as the composite chart below shows.

BOM
Generally, Phase 3 events support cooler than normal temperatures in the United States, while Phase 4 composites indicate warmth prevails across the country. Purely due to how February looks to shape up, I would favor a chillier outlook to kick off March. This method of persistence forecasting tends to work well, particularly when the pattern seems to 'lock in' to a certain temperature alignment; in this case, a cold Central and East US, with warmth in the West.

CPC
Looking even further out, just for kicks, let's go over sea surface temperature anomalies, under the surface. Anomalies show the 'warm part', the upwelling phase of a Kelvin wave moving eastward at a depth of about 100 to 200 meters. We're currently seeing the 'cold part' of that Kelvin wave, the downwelling phase, hitting the surface from about the 100 west longitude line on eastward. The warmth from the upwelling is already at the surface in the Central Pacific, and this could be setting up a more El Nino-like pattern. I personally find this to be plausible, as El Nino winters are notorious for a slow start and furious end, as we're seeing in real time right now in the East US.
In springs with an El Nino, temperatures in the North US will generally be warmer than normal, while the opposite scenario plays out in the South, with colder than normal temperatures. It remains to be seen if this will play out in the March-April-May period, but it'll be something to watch.

To summarize:

- A very cold pattern will unfold over the next 7-14 days.
- There are hints of a warmer pattern coming around for the period beyond 14 days, but this needs to be watched for potential failure.
- It is expected that the East will remain overall below normal throughout the entire period in temperatures. A similar story, though not as cold, may be expected in the Central US.
- Snowfall should favor the East US in this entire pattern, though a shift to a more inland track could occur in late February if model guidance ends up being correct.

Andrew

Saturday, February 7, 2015

February 22-27 Potential Winter Storm

Model guidance has been hinting at a rather strong winter storm impacting the United States around a February 22-27 period.

Tropical Tidbits
Click images to enlarge
The above image shows the GFS forecast of 500mb geopotential height values (colored shadings) and mean sea level pressure contours over the West Pacific, valid on February 16th. In this image, which is from the GFS model run on the morning of February 4th, we see a very strong low pressure system crossing Japan and moving away from the country as it does so, with a minimum central pressure here of 987 millibars. This is a very strong system, but one might argue that can be expected from long range guidance, which can/does tend to over-amplify storms in long-range forecasts.

Since that forecast was made, at least 5 other GFS runs came in with very similar solutions, meaning this could be a valid storm potential. You'll notice that the timeframe isn't exactly the same on each graphic, but the storm impacting Japan between February 16-17 is generally agreed upon.

Tropical Tidbits

Tropical Tidbits

Tropical Tidbits

Tropical Tidbits

Tropical Tidbits
While this model remains inconsistent as far as showing this storm run-after-run, the general concept of a storm in this timeframe is still present (for now).

When we apply the Typhoon Rule, which states weather phenomena occurring in Japan is reciprocated in the United States 6-10 days later, we can extrapolate the storm in this February 16-17 timeframe to get a rough estimate of a February 22-27 correlation here in the US, padding in a couple days for uncertainty. But we may also be able to figure out where it tracks.

ESRL
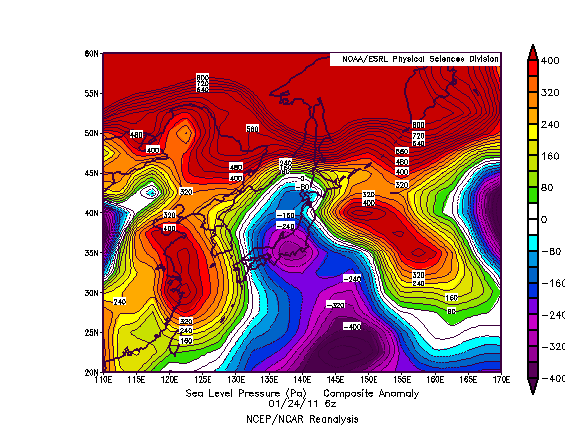
The above image shows sea level pressure anomalies on the morning of January 24th, 2011. On this day, we saw a storm system cross Japan and rapidly strengthen as it began to exit the eastern coast of this country. Just for kicks, let's apply the Typhoon Rule here. If we do so, we likely saw a storm system impact the country between January 30th and February 3rd, 2011.
Some of you might remember that as the Groundhog Day Blizzard of 2011, which dropped close to 24" of snow in Chicago, IL, as well as incredible ice accumulations in the cold sector of this storm. When we compare the projected track of our mid-February storm in the GFS images above, we see that some (not all) forecasts have the upcoming low taking a similar track as the eventual-Groundhog Blizzard did. That's not to say I'm expecting another massive blizzard. I'm just trying to show where this storm could end up tracking, and that could be through the Midwest yet again.

Tropical Tidbits
There's also the chance we see this storm go through the East US and impact that area primarily. The reasoning behind this is the expected ridge-out-west and trough-out-east pattern which will likely deliver more than one round of accumulating snow to the East (more on this can be found in yesterday's post). The image above shows the GFS ensemble outlook at the very end of its run, depicting 500-mb geopotential height anomalies for February 22, 2015. We see a gradual departure of the trough in the East into Greenland, though the ridge in the West is still persisting. Personally, I'd bet more on the trough staying put purely out of persistence forecasting, but that's why you take model guidance with your own opinion. If this forecast did work out, however, the storm could impact the Central US and East US, whereas the trough staying put would result in an impact likely for the East.

CPC
If we factor in tropical forcing, we get yet another different picture. When the timeframe for this storm rolls around, enhanced tropical convection is forecasted (not shown here) to be placed in an area around and just east of the 90ª East longitude line, which places us in Phases 4 or 5 of the Madden-Julian Oscillation (MJO). The above graphic shows precipitation anomalies on the left two columns; we'll ignore the colorful columns on the right for now. When we look at precipitation anomalies during Phase 4 and 5 in a January-February-March period, we tend to see the Central US into the Northeast getting in on storm activity. This could mean the storm in late February, if it happens to begin with, will hit both the Central US and East US, but anything beyond that is purely guessing.

To summarize:

- There are indications a strong storm could hit Japan in the middle of February.
- This could result in a strong storm in the United States between February 22 and February 27.
- It is not known who will/could be affected by this system yet.
- As the post thoroughly showed, significant uncertainty surrounds this event.

Andrew

Friday, February 6, 2015

Upcoming Pattern Very Favorable for East Coast Snowstorms

The upcoming pattern appears to be very favorable for snowstorms along the East Coast.

Tropical Tidbits
The above image shows the 500mb geopotential height anomaly field over North America, forecasted by the GFS Ensembles from February 11th to February 16th. In this graphic, we see a strong upper level low dipping down over the Bering Sea, forcing a strong ridge to blossom along the Western US. A Rex Block then forms in the Southwest, as an upper level low slides under the ridge. Usually, a Rex Block upstream creates zonal flow downstream, but instead of rather calm weather in the East US, we see a deep upper level low pushing its way into the Northeast. This looks to be the pattern for the next 2 weeks or so.

In this sort of pattern, sustained northwest flow (winds from the northwest) often leads to a 'clipper train', where a multitude of Alberta Clippers slides southeast-ward into the Central US. These clippers can then move east off the coast, and can intensify to produce heavy accumulating snow for the East US. I believe that this is a possibility, and could happen more than once in the next couple of weeks.

Unisys
A look at sea surface temperatures shows how potent this environment is. For now, we'll focus on the East Coast. Notice all the oranges and reds immediately along the coastline, extending a bit east. Those are very warm waters, with well-above normal anomalies being detected. Consequentially, any clippers that move off the coast and threaten the East will have unusually warm waters to work with, which could very well enhance snowfall totals.

To summarize:

- The upcoming pattern is favorable for accumulating snowfall in the East US.
- This pattern may support more than one event of plowable snow.
- Extreme cold may affect the Northeast, at times.

Andrew

Thursday, January 15, 2015

Significant Arctic Outbreak Threat Rising for Late January

Model guidance is combining with the long range tools commonly used on this blog (namely the Typhoon Rule) to portray the country's best shot at true wintry weather to end the month of January.

We'll start off with the Typhoon Rule.

Tropical Tidbits
Click on any image to enlarge
The above image shows the GFS forecasted 500mb geopotential height anomaly forecast in the West Pacific region, valid for the morning of January 17th. In this image, we see warm colors, indicative of positive height anomalies / typically warm and quiet weather, but we see a much different picture over Japan. In Japan, a strong upper level low is impacting the country, sliding to the east as it does so. Notice how the center of this upper level low appears to go directly over far northern Japan.

The Typhoon Rule can be used to predict weather phenomenon in the United States. The rule of thumb indicates that weather phenomena impacting Japan is reciprocated in the US about 6-10 days later. So, if we see a strong (and very cold) upper level low crossing northern Japan on January 17th, we can extrapolate this upper level low to "re-appear" in the US on a January 23-27th timeframe.

Does this solution have any support from ensemble guidance? Let's find out.

Weatheronline
The image above shows 500mb geopotential height values (not anomalies) from the prestigious ECMWF ensembles set, valid on January 25th. These types of charts are generally used to identify the presence of large-scale ridges or troughs. In this image, we see a very pronounced depression in the contour lines, bringing the 520gpdm line all the way down just south of the Canada/USA border. This depression of contours shows the presence of a strong upper level low, which is actually centered all the way up in northern Canada.

The strong upper level low is being forced southward due to that strong ridge of high pressure developing along the West Coast. Other guidance eventually does much bigger things with that ridge even further down the road, but we'll get to that a little later on in this post. For now, the takeaway from this forecast is very cold conditions might be on deck for the late January period. I have discussed this end-of-the-month timeframe for some cold weather in earlier posts, but its significance is quickly becoming more realized.

ESRL
Next up, we'll analyze the ensembles off of the ESRL agency, a physics-based modeling branch of the NOAA body. In this image, showing 500mb geopotential anomalies for January 26th, we see a similar layout as the ECMWF ensembles showed. Strong negative height anomalies are developing in the Central and East US as the ridge along the West Coast continues to build and push northward. In these sorts of situations, the ridge may force itself so far north that it becomes a 'blocking' mechanism.

What is 'blocking'? My favorite example is to imagine a highway, with traffic moving along at an even pace. That's a good representation of the atmosphere during 'normal' flow. Now, imagine something happens on the highway that forces the cars to stop - a back-up, perhaps. The cause of this 'back-up' is analogous to the blocking ridge of high pressure; the ridge forces itself towards the North Pole and blocks the atmospheric flow from moving things along. This has been known to produce flooding, long-lasting cold, or intense warmth, depending on the season and who is affected.

ESRL
The upcoming pattern is very similar to that shown by the negative phase of the West Pacific Oscillation (WPO). In the image above, we see typical temperature (bottom panel) and 500mb geopotential height anomaly (top panel) values for a positive WPO phase. Notice how stormy conditions persist just west of the Bering Sea during a +WPO phase, leading to warmth across most of the Central and East US.

To see the typical conditions during a negative WPO phase, just flip the color scale. We then see intense ridging just to the west of the Bering Sea, leading to sustained cold flooding the Central and East US. The eventual alignment of this ridge into the waters near the Bering Sea, as the GFS ensembles are indicating, would lead to this -WPO pattern.

The final (and what I consider the most surprising) part we have to go over is the analog forecast.

CPC
This image shows projected 500mb geopotential height anomalies, valid for about 11 days from today, based on the top ten analogs (dates with the atmospheric pattern similar to the one forecasted to occur 11 days from today) produced at the Climate Prediction Center. In this image, we can see that strong ridge along the West Coast of North America into Alaska, resulting in below-normal anomalies over the Central and East US, eastern Canada, and into Greenland. Just for kicks, let's see what the top analog of 20090118 (January 18, 2009) shows, since it has been deemed the most similar to the forecast down the road.

ESRL
Above, we see temperature anomalies from January 16, 2009. I went back two days as the cold wave had already pushed east by January 18th; we want to get a diagnosis of the cold wave itself. This graphic is in units of Kelvins, but we can easily convert to Fahrenheit.

The core of the cold extends from southeastern Minnesota into far western West Virginia. A spot of values below -17.5 degrees below normal (Kelvin) shows up along the border of Indiana and Ohio. Let's see how -17.5 degrees below normal in Kelvins translates to Fahrenheit. Doing the math, that area saw temperatures 32 degrees (Fahrenheit) below normal for this cold wave, deemed the most similar to what we could see to end January. That's very impressive; for a scale of how impressive it is, consider that the average temperature in Richmond, Indiana (very close, if not inside that -17.5 Kelvin anomaly) to end January is 37 to 38 degrees F. In this cold snap, temperatures likely dipped down to just above zero, with even colder conditions to the north.

By no means does this mean we'll see something as cold as what happened on January 16, 2009, but it gives you an idea of the type of pattern that's coming down the pipe to end January.

To summarize:

- Model guidance and the Typhoon Rule are in agreement concerning a potentially significant cold blast at the end of January.

Andrew

Friday, December 5, 2014

Updated December Long Range Forecast

In an effort to cut down on confusion that has been stirred up in recent days, I'm publishing this post to give an idea of my thoughts for the rest of the month.

To stay as accurate as possible, we'll start off with the weather overseas.

Tropical Tidbits
The image above shows forecasted 500mb height anomalies over the West Pacific. In this image, valid on December 6th, we see a deep trough over Japan. Those of you who have followed us for a while know that stormy weather over Japan correlates to stormy weather here about 6-10 days later. This graphic tells us that the weather will likely be colder than normal on a December 12-16th timeframe, possibly with an accompanying storm system (but I wouldn't hold my breath for it).

Tropical Tidbits
By December 10th, the trough has moved out and a ridge has filled in. This ridge won't be of a spectacular magnitude, but it looks strong enough to indicate quiet and warm weather here in the United States in a December 16th-20th time period.

Tropical Tidbits
The last image I'll show you with relations to Japan is above, valid on December 13th. Looking at East Asia, notice an elongated trough to the north of the island nation, inducing below-normal height anomalies in the country. Using the Typhoon Rule, we can approximate a cold/stormy period following the aforementioned ridge, namely in a December 19-23 period, if not for longer. It should be noted that this trough doesn't "dig" south into Japan, raising concerns that a zonal flow (average to slightly warm) pattern may evolve instead of this cold weather. I will issue additional updates as needed.

ESRL
Top left: PNA Forecast
Top right: NAO Forecast
Bottom left: WPO Forecast
Bottom right: EPO Forecast

A quick refresher on the PNA and NAO...

The Pacific North American index involves what the atmosphere does in the northeast Pacific and the western coast of North America. When we see a stormy pattern in place over these regions, we call such a pattern a negative PNA, due to the below normal height anomalies in this region. In a similar sense, when high pressure dominates that same region, we call that a positive PNA. A negative PNA will bend the jet stream to give the storms to the Plains and the Deep South regions, frequently initiating high pressure system formations over the Central US. A Positive PNA will bring about an opposite response to high pressure (HP) over the West, and will have the stormy pattern evolve over the East US.

The North Atlantic Oscillation involves the presence of a high pressure system over Greenland (negative NAO) or the presence of a low pressure system over Greenland (positive NAO). In the negative NAO, the jet stream will buckle into the Northeast to allow storms and cold to thrive in that region. The positive NAO denies this region any of these benefits.

Glancing over this four-panel forecast, we find that the PNA is expected to stay positive throughout the entire forecast period. This will allow for high pressure to reside in the West, which would usually give way to a cold period in the Central and East US. However, on the next panel, the positive NAO projection tells us this ridge will be allowed to bleed east into those aforementioned areas, keeping most of the country warmer than normal.
The positive WPO and EPO, both Pacific teleconnections, are good for cold weather prospects in the Central and East US, but until that positive NAO ends, we're likely stuck with a warm period.

Wait... so you're predicting some good cold shots, but also a warm period for the same timeframe?

The idea I'm getting right now is that the next 10-15 days of December are looking predominantly warm. However, in between those warm spells, some cold air outbreaks (not intense, but still noticeable) may be expected. This is a pretty turbulent forecast period, since I'm experiencing a good deal of uncertainty.

* For those of you who have been following on Facebook and were confused by my analog postings last night, please disregard those postings and go with this article as your guide to my expectations.

To summarize:

- A cold spell may be expected in a December 12-16 period.
- Warmth will then follow in December 16-20th, roughly.
- Around December 19-23 and beyond, the risk of below-normal temperatures may return, but uncertainty is high.
- The overall pattern remains generally unfavorable for sustained cold weather.

Andrew

Sunday, November 16, 2014

November 22-25 Potentially Significant Winter Storm

A powerful storm looks to present itself to the US around the November 22-25 timeframe.

Tropical Tidbits
Since this post will primarily be a model analysis, we'll begin with the ECMWF-Ensembles. This image shows the forecasted 500mb geopotential height values in the color shadings, with sea level pressure contours and high/low pressure demarcations superimposed. In this graphic, valid for the evening of November 24th, we see a storm system placed on the border of northeast Illinois into northwest Indiana. The minimum pressure is about 1003 millibars, which is a rather weak storm system. Despite its weakness, the mere presence of a storm on this graphic tells us there is some confidence in a storm occurring within this timeframe. Confidence is low to begin with, but it is there.

Tropical Tidbits
We now move on to the ECMWF model, also showing 500mb geopotential height values and SLP contours. For future reference, those two parameters will show up on all model graphics we analyze here today. The ECMWF model favors a very strong 987 millibar storm striking central Illinois on the morning of November 24th, with windy conditions overtaking the Ohio Valley and East US within the storm's warm sector. The sub-540 geopotential height values in the Midwest tell us that a widespread accumulating snow event would likely occur, particularly in the central and northern Plains into the Upper Midwest.

Tropical Tidbits
Pushing ahead, we now analyze the GFS ensembles forecast, valid here for the evening of November 24th. We find a weak low pressure system over central Lake Michigan, with a minimum central pressure reading of about 1005 millibars. Ensemble systems typically tend to be weaker than their operational counterparts (as observed with the ECMWF-Ensemble and ECMWF graphics above), since the ensembles take into account double-digit forecasts and average them all out. Regardless, the mere presence of a storm system is re-assuring to confidence.

Tropical Tidbits
Continuing on, we arrive at the GEM model forecast, valid on the evening of November 24th. The GEM, made by the Canadian meteorological service, shows a deep low pressure system of about 995 millibars right over Chicago, Illinois. This would support some stormy activity from the Southern Plains to the East Coast, but due to the retracted 540 line into the far Northern Plains, I'm not confident that this model is supporting a snowstorm for the Upper Midwest and Central/Northern Plains.

Tropical Tidbits
We now arrive at the GFS Ensembles, which paints an interesting picture for this storm. We see a storm system of minimum central pressure 1001 millibars placed just south of Chicago. This graphic, valid on the evening of November 24th, also draws the 540 line south into the Midwest and Central Plains. Again, since this is an ensemble forecast, the storm is not as strong as individual model forecasts. However, since it is showing up in the first place, confidence continues to rise in a substantial storm in this timeframe.

Tropical Tidbits
We've saved the best for last: The above graphic depicts the GFS-Parallel model forecast for this storm. We see a 979 millibar storm striking the northeast Illinois-southeast Wisconsin border, while 500mb geopotential height color shadings tell this storm to be a closed low. With very windy and cold conditions extending across the Midwest and Great Lakes, an accumulating snow event would likely be expected in the Upper Midwest and Northern Plains.


To summarize:

- Model guidance is confirming the possibility of a substantial storm in the November 22-25 timeframe.
- Some guidance supports a powerful storm system, possibly bringing both accumulating snow to the Upper Midwest, and severe weather to the East/Southeast.
- Confidence in this solution remains low due to the extended timeframe of this storm.

Additional updates will be posted in the coming week as more information becomes available.

Andrew