Showing posts with label GFS. Show all posts

Wednesday, February 25, 2015

March 1-2 Potential Winter Storm

Model guidance has been indicating a winter storm will track across the middle of the country, bringing accumulating snow to those further south of where much of the wintry weather has occurred this winter.

Tropical Tidbits
The image above shows the GFS forecast for precipitation type and intensity, valid for Sunday night. We see light to moderate, possibly even heavy snow falling across the Midwest, Great Lakes, and Ohio Valley. A classic signal of winter finally on its way out, the rain/snow line is displaced pretty far north in comparison to where it has been in recent days and weeks, with rain being a concern in southern Illinois into southern Ohio. A bit of mixed precipitation could impact those in the central Plains.

Instant Weather Maps
Snowfall projections have been waving back and forth with the axis of heaviest accumulations, but the latest GFS pegs a swath of 6-10" accumulations across the central Plains into the Midwest and central Great Lakes, with Kansas, northern Missouri, central Illinois and northern Indiana receiving the most snow.

To summarize:

- Model guidance is anticipating a winter storm to affect the country over the next few days.
- Snowfall on the order of 6-10" may be expected.
- While the track of this storm is still not nailed down yet, the central Plains and Midwest ought to see the most intense snow accumulations.

Andrew 

Monday, February 16, 2015

Chicago, Milwaukee Bracing for Severe Arctic Cold

Midwestern cities such as Chicago and Milwaukee are bracing for cold that could drop temperatures well into the double-digit negatives. This sort of cold has been seen recently east of Lake Michigan, but will make its first appearance of the month in more western regions this workweek.

Tropical Tidbits
Click images to enlarge
The above image shows the latest GFS model forecast for air temperatures on Thursday morning at 6AM, fresh off the presses. We see temperatures near Madison, Wisconsin plummeting to -15 degrees Fahrenheit, with Minneapolis seeing similar readings. Chicago looks to be under the gun for -10 to -15 degree temperatures, while Springfield, IL may see relatively warmer values.
There is model discrepancy with respect to how cold this air mass will be. The GFS model is favoring a much colder solution, as we see above, while the short-range NAM model (not shown) is favoring a warmer solution. One model has to cave at some point; it's a waiting game to figure out which one. For now, better safe than sorry.

Tropical Tidbits
Friday morning is the tricky forecast for these Midwestern cities. Skies will be clear for swaths of the Midwest, and with much of the area under a snow pack, temperatures could drop even lower than Thursday morning readings. However, in addition to the NAM model favoring a warmer air mass, warm air advection will be ongoing across the Plains into the Midwest. Discrepancies remain with respect to how fast this warmer air will push into the Midwest, and how intense it will be. For now, I'm taking more of a wait-and-see approach, but preparing for the worst. Again, better safe than sorry.

Purely for eye candy, as in this will not verify, check out the Canadian model air temperature forecast for Friday morning.

Tropical Tidbits
To summarize:

- The Midwest may undergo its most severe wave of cold weather this season, with cities such as Chicago, Milwaukee and Minneapolis going below the -10 degree F benchmark.
- Unusually high uncertainty still exists surrounding the intensity of this cold air on both Thursday and Friday. Any updates to this post will be made on either our Facebook or Twitter pages.

Andrew

Saturday, February 14, 2015

February 15-19 Potential Snowstorm and Ice Storm

The February 15 through 19 period is increasing in likelihood that we will see a winter storm, potentially with an ice storm component.

Tropical Tidbits
Click images to enlarge
The image above shows the GFS forecast for precipitation type over the United States for the morning of February 16th. Here, we see precipitation breaking out over the Southern Plains and along the Gulf Coast as a low pressure system advects northeast-ward. In this forecast, we see a snow shield placed from southern Illinois into Missouri, Arkansas, and the Tennessee/Kentucky area, with rain blossoming in Texas, Louisiana, and southern Mississippi. We also see a rather broad swath of sleet, potentially freezing rain in southeast Oklahoma, central Arkansas, and northern Mississippi. This freezing rain/sleet delineation could prove to be a serious issue for those in the South, especially with memories of the ice storm from last year still fresh.

Tropical Tidbits
By the evening of February 16th, the low pressure system responsible for this precipitation is trekking along the Gulf Coast, located along the Mississippi/Alabama border in this graphic. A rain shield encompasses Louisiana, Mississippi, and a good chunk of both Alabama and Georgia. Snow is falling in eastern Tennessee, the western Carolinas, and extreme western Virginia, with a small band of freezing rain / sleet in northern Mississippi and Georgia. It's encouraging to see the freezing rain shield shrink from our last image, but as freezing rain is so tricky to predict, I wouldn't take that part of this forecast verbatim.

Tropical Tidbits
By early morning on February 18th, the storm has transferred offshore and is beginning to strengthen over warm waters along the coast of the East US. Snow continues to fall in much of North and South Carolina, with rain prevailing in southern Georgia and much of Florida. Heavier bands of snow are already impacting coastline locations in the Mid-Atlantic and Northeast, with New Jersey on the northern fringe of this heavy snow shield. From there, the storm continues north and east.

Snow accumulation charts are unreliable in this case, as some methods for snowfall will accidentally count freezing rain and sleet as snow, unrealistically amplifying snow totals. Thus, it would be unwise to show a snow total chart for those in Arkansas, where that unrealistic amplification of totals is likely to occur.

WxCaster
I want to now look at the forecasted freezing rain accumulation chart from the short-range NAM model over the Eastern US. In this chart, we can see where freezing rain is most likely to occur. Again, because freezing rain is so hard to predict in advance, take this with a relative grain of salt. Regardless, let's see who may be affected. The highest freezing rain totals appear in western South Carolina, where accumulations of 0.50" to 0.75" could be found. Significant accumulations of 0.25" to 0.50" extend through the rest of the Carolinas, and isolated spots of similar totals stretch back through northern Mississippi, Georgia and Alabama, all the way to southern Arkansas. While you shouldn't expect to see this chart verify exactly as-is, it gives you a good idea as to who may be affected by freezing rain from this storm.

To summarize:

- A storm system in the Southern US looks to bring wintry precipitation to states such as Arkansas, Mississippi, Alabama, Georgia, Tennessee, Kentucky, and the Carolinas.
- Accumulating snowfall is possible, particularly in Tennessee and Kentucky.
- Accumulating freezing rain is possible, particularly in southern Arkansas, northern Mississippi, Alabama, Georgia, and the Carolinas.

Andrew

Saturday, February 7, 2015

February 22-27 Potential Winter Storm

Model guidance has been hinting at a rather strong winter storm impacting the United States around a February 22-27 period.

Tropical Tidbits
Click images to enlarge
The above image shows the GFS forecast of 500mb geopotential height values (colored shadings) and mean sea level pressure contours over the West Pacific, valid on February 16th. In this image, which is from the GFS model run on the morning of February 4th, we see a very strong low pressure system crossing Japan and moving away from the country as it does so, with a minimum central pressure here of 987 millibars. This is a very strong system, but one might argue that can be expected from long range guidance, which can/does tend to over-amplify storms in long-range forecasts.

Since that forecast was made, at least 5 other GFS runs came in with very similar solutions, meaning this could be a valid storm potential. You'll notice that the timeframe isn't exactly the same on each graphic, but the storm impacting Japan between February 16-17 is generally agreed upon.

Tropical Tidbits

Tropical Tidbits

Tropical Tidbits

Tropical Tidbits

Tropical Tidbits
While this model remains inconsistent as far as showing this storm run-after-run, the general concept of a storm in this timeframe is still present (for now).

When we apply the Typhoon Rule, which states weather phenomena occurring in Japan is reciprocated in the United States 6-10 days later, we can extrapolate the storm in this February 16-17 timeframe to get a rough estimate of a February 22-27 correlation here in the US, padding in a couple days for uncertainty. But we may also be able to figure out where it tracks.

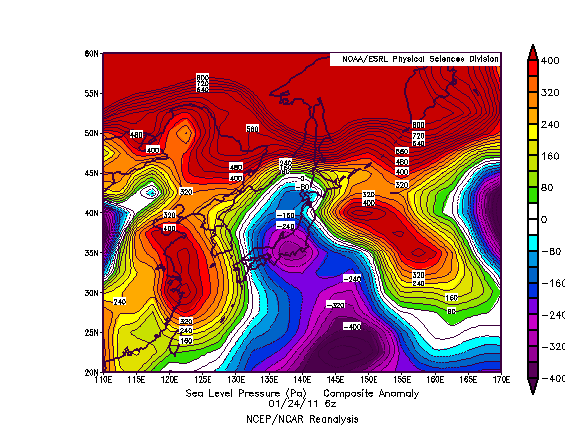
ESRL
The above image shows sea level pressure anomalies on the morning of January 24th, 2011. On this day, we saw a storm system cross Japan and rapidly strengthen as it began to exit the eastern coast of this country. Just for kicks, let's apply the Typhoon Rule here. If we do so, we likely saw a storm system impact the country between January 30th and February 3rd, 2011.
Some of you might remember that as the Groundhog Day Blizzard of 2011, which dropped close to 24" of snow in Chicago, IL, as well as incredible ice accumulations in the cold sector of this storm. When we compare the projected track of our mid-February storm in the GFS images above, we see that some (not all) forecasts have the upcoming low taking a similar track as the eventual-Groundhog Blizzard did. That's not to say I'm expecting another massive blizzard. I'm just trying to show where this storm could end up tracking, and that could be through the Midwest yet again.

Tropical Tidbits
There's also the chance we see this storm go through the East US and impact that area primarily. The reasoning behind this is the expected ridge-out-west and trough-out-east pattern which will likely deliver more than one round of accumulating snow to the East (more on this can be found in yesterday's post). The image above shows the GFS ensemble outlook at the very end of its run, depicting 500-mb geopotential height anomalies for February 22, 2015. We see a gradual departure of the trough in the East into Greenland, though the ridge in the West is still persisting. Personally, I'd bet more on the trough staying put purely out of persistence forecasting, but that's why you take model guidance with your own opinion. If this forecast did work out, however, the storm could impact the Central US and East US, whereas the trough staying put would result in an impact likely for the East.

CPC
If we factor in tropical forcing, we get yet another different picture. When the timeframe for this storm rolls around, enhanced tropical convection is forecasted (not shown here) to be placed in an area around and just east of the 90ยช East longitude line, which places us in Phases 4 or 5 of the Madden-Julian Oscillation (MJO). The above graphic shows precipitation anomalies on the left two columns; we'll ignore the colorful columns on the right for now. When we look at precipitation anomalies during Phase 4 and 5 in a January-February-March period, we tend to see the Central US into the Northeast getting in on storm activity. This could mean the storm in late February, if it happens to begin with, will hit both the Central US and East US, but anything beyond that is purely guessing.

To summarize:

- There are indications a strong storm could hit Japan in the middle of February.
- This could result in a strong storm in the United States between February 22 and February 27.
- It is not known who will/could be affected by this system yet.
- As the post thoroughly showed, significant uncertainty surrounds this event.

Andrew

Thursday, January 29, 2015

January 31 - February 2 Potentially Significant Winter Storm

A potentially significant winter storm is taking aim at a large swath of the country this weekend into the start of next workweek.

Tropical Tidbits
Click images to enlarge
The image above shows the latest GFS forecast for precipitation, mean sea level pressure (MSLP) values, and 1000-500mb thickness values (dashed blue and red lines) on the evening of February 1st. The prognosis calls for energy coming from the Southwest, moving eastward where interaction with additional energy out of Canada may occur. The more interaction these two systems have, the more snow & overall precipitation may fall. The caveats associated with this storm include storm track, strength, snow amounts, interaction between the two pieces of energy, among other items. We'll address some of these here today.

I'll start off right away and say that I think we see this storm either maintain its current position, or even shift south a bit more. Why? I'm glad you asked.

Tropical Tidbits
Here's a look at 500mb vorticity values from January 22nd, over the West Pacific. Notice how we see a positively-tilted piece of energy making its way eastward over Japan, with another piece of energy sliding southward from higher latitudes. Does this set-up look familiar? It should, because the Typhoon Rule says this will be how our storm will evolve. After this point in time, the two pieces of energy approached each other, but did not phase/interact until they were well east of Japan. To me, this means our storm coming up this weekend may not phase as easily as model guidance is saying. It is known that weather models tend to phase storms too readily, and this could be a prime example of that bias showing through. If that is true, this storm would likely stick further south.

CPC
Additionally, and perhaps most importantly, this storm will occur under predominantly northwest flow, with a strong lobe of the tropospheric polar vortex pressing southward from Canada. In this 500mb height contour map, valid for February 1st, we see that lobe of the vortex creating for a very tight gradient in the North US. This could very well act to suppress the storm further south, possibly more than what is currently being advertised. Second, notice how the height contours in Canada seem to be diving southeast into the US. This is what is called 'northwest flow', where the air in the United States is coming from the northwest. Because this is happening, I find it rather plausible we see the storm pushed further south, as strong surface high pressure dropping southward from Canada will also be playing a role here. In case you haven't guessed yet, I'm not finding many factors favoring a north shift.

Instant Weather Maps
One positive thing I am seeing is that model guidance is likely under-forecasting precipitation for this storm. Above, we see the GFS model forecast for low-level relative humidity on February 1st. You can see just how moist this storm will be, with high RH values stretching from the eastern Rockies all the way to the waters offshore the East Coast. This moisture will be driven from the Gulf, hence why I find it plausible, if not likely, more precipitation occurs in this storm than what is being modeled right now.

The question then arises, could this favor prove to stab the wintry portion in the back? Thunderstorms in the warm sector of winter storms have been known to rob the wintry sector of moisture, leading to more rain than forecasted and less snow than forecast. This will be something we'll need to watch when the storm commences.

Tropical Tidbits
Storm track forecasts should really begin to solidify by Sunday(!!), when both pieces of energy relevant to this event move into the United States. Right now, the energy from the Southwest is slowly moving east onshore California, which should aid in model accuracy, gradually, in coming forecasts. An interesting question being posed is, what if latest model guidance inching north in the last day or so has something to do with that energy near California coming onshore? Could it spell a further north track down the road? Anything's possible, sure, but I'll stick with a southern track for now.

Here's my forecast graphic for this event.
The Weather Centre

To summarize:

- Model guidance is in agreement on a potentially significant snowstorm impacting the North US this weekend.
- Amounts in the hardest-hit regions may exceed 12", but this may need revision in later updates.
- High uncertainty still exists.

Andrew

Wednesday, January 14, 2015

January 21-25 Potentially Significant Winter Storm

It's looking as if a winter storm will impact the United States between January 21st and January 25th. As of now, this storm has potential to be a strong one.

Tropical Tidbits
The above image shows mean sea level pressure (MSLP) and precipitation values for the morning of January 15th over the West Pacific. In this graphic, we see a strong low pressure system moving up the eastern coast of Japan, delivering heavy precipitation to areas offshore of the island nation. A look at 500mb vorticity values (not shown) depicts this storm phasing with another piece of energy to strengthen and mature the energy into a substantial event.

If we recall that the Typhoon Rule states weather phenomenon occurring in East Asia is replicated here in the United States about 6-10 days later, we should expect a storm system, possibly strong, to hit the US in a January 21-25 timeframe. The orientation of this storm striking the east coast of Japan tells me it may come up from the South US and hug the East Coast here in the US.

Interestingly enough, model guidance is approving of this theory.

Tropical Tidbits
The new GFS (the old GFS model was retired with this morning's 12z / 6AM central time runs, and replaced by what was known as the GFS-Parallel model) is showing a storm system developing in the Southeastern US on January 23rd. Here, we see a large swath of heavy rain, likely containing thunderstorms draped across the Gulf Coast into the Mid-Atlantic, as well as a heavy snow swath spread across the Ohio Valley and into the Northeast. This is something like I would expect to see happen with the way our energy acts when it skirts around Japan in the earlier graphic we analyzed.

Tropical Tidbits
By the evening of January 23rd, we find our storm has moved offshore, dragging an impressive liquid precipitation shield behind it, which then drags behind it a very cold airmass to introduce the anticipated cold blast to close out January. A strong snow swath remains present, but the most intense snow appears to strike Long Island in New York, as well as other coastal spots. Lighter, but still impressive snows then impact more inland regions.

To summarize:

- A storm is expected to impact the United States between January 21 and January 25.
- This storm has the potential to be strong, per current guidance.

Andrew

Friday, January 9, 2015

January 17-21 Potential Winter Storm

There is potential for a disturbance in the January 17-21 timeframe.

Tropical Tidbits
The above image shows 500mb vorticity values across the Western Pacific from the (soon to be retired) GFS model, valid the morning of January 11th. Here, we see elevated vorticity values pushing east from the mainland of Asia. Of note is the shortwave evident just west of Japan, as the depression in the 500mb contour lines shows. This is the storm system we are watching.

A look at mean sea level pressure (MSLP) values for this same timeframe indicates the storm would be crossing almost squarely over the middle of Japan. Using the Typhoon Rule for timeframe, extrapolating the date of this graphic out 6-10 days, we come up with a possible storm in the US during a January 17-21 timeframe.

ESRL
The above image shows teleconnection forecasts from the ESRL agency shows the Pacific North American index dropping to near-neutral levels when this storm is projected to strike. Add in the moderately-positive NAO forecast, and chances are this storm will mainly take a west-to-east track, and is unlikely to "cut" north or south in any drastic manner.

To summarize:

- A storm system may impact the US during the January 17-21 timeframe.
- Indications are this storm could affect primarily the mid-section of the country.

Andrew

Friday, January 2, 2015

Tropospheric Polar Vortex May Deliver Record Cold on January 7-9th

Nearly one year to the day after the tropospheric polar vortex was sent into southern Canada to bring record-breaking cold into the United States, model guidance is unleashing another round of record cold to kick off 2015.

Before we get started, please read this infographic from the National Weather Service to understand what the polar vortex is and is not.

NWS
*Note: The controversial phrase 'polar vortex' is used in this article for purposes of communication to the public, instead of 'Massive Arctic Semi-Permanent Upper Level Low', which would not only be too long to type over and over again, but is also not as effective at communicating this threat to others. 

Tropical Tidbits
The above image shows the European model ECMWF's forecast of 500mb geopotential height anomalies, for the evening of Wednesday, January 7th. Note how we see strong high pressure forcing its way into the Arctic from the Bering Sea. This dislodges the tropospheric version of the polar vortex, and seemingly splits it into two bodies; one just east of Greenland, and another in the East US. That dark blue area represents the lobe of the polar vortex, and if you closely observe the 500mb height contours on this chart, you can see that the lobe gets as far south as the border of New England and Canada before shooting east. The GFS model agrees on this polar intrusion.

So... what can we expect for this latest cold blast?

Tropical Tidbits

Now switching to the American GFS model, as ECMWF temperature products are pay-to-view and may not be posted on this website, we see the cold really begins to set in on the morning of January 7th. We see temperatures on the surface of -25 degrees Fahrenheit over the Dakotas, with major cities like Des Moines, Chicago, Milwaukee, and Minneapolis all sub-zero. Similar to the Arctic air outbreak last January, this is pure Arctic air. This is dangerous and potentially life threatening, IF current forecasts are correct.

Tropical Tidbits
By Thursday morning, the cold recedes from the Plains to some degree, but hits the Great Lakes hard, as Chicago goes sub-negative-15 degrees on January 8th, with similar fates meeting the Quad Cities, Madison, and even Gary, Indiana. It's very possible that any snow cover put down by the January 3-5 winter storm, as well as the January 5-6 clipper, may intensify this cold blast further than models are predicting.

Although I can not post temperature forecasts of the ECMWF model, here are a few key points that I can paraphrase for you:
- Temperatures by midday Wednesday are sub-zero north of a line from Springfield, IL to North Platte, NE.
- Temperatures on Thursday morning bottom out around -22 degrees F in central Wisconsin, with widespread double-digit sub-zero temperatures around the Midwest and Great Lakes. Madison, Minneapolis, and Chicago all hover around -15 to -20F.

To summarize:

- Model guidance is in agreement on a record-breaking cold blast to hit the United States on January 7th and 8th.
- Temperatures, if forecasts are correct, will plunge below -20 degrees Fahrenheit in the North Plains and Upper Midwest, with double-digit negative temperatures widespread across the Midwest, Plains, and Great Lakes.
- High uncertainty still exists with this event, but confidence is gradually rising.
- Residents across the United States must be watchful of future forecasts, as this will be a deadly cold wave if it comes to fruition.

Andrew

Sunday, November 9, 2014

November 8-12 Significant Snowstorm - Final Update

This is the Final Update for this significant November 8-12 snowstorm.

NWS
Winter storm watches (dark blue) and warnings (pink) have been hoisted across a swath of the Upper Midwest into the Northern Plains, as a strong storm system looks to push south into the US and create a potentially dangerous environment for those caught by surprise from this storm. Winter weather advisories (purple) have also been issued for areas where the storm will strike earlier, compared to those in the Midwest.

Tropical Tidbits
The image above shows the GFS model's forecasted total snowfall from this storm over the next 4 days. We can see how the storm is forecasted to lay down amounts near 12" in the Northern Plains, before unleashing on the Upper Midwest. The yellow swath shows amounts in excess of 18" of snow, while those brown-ish areas depict amounts close to two feet of snow. Going by this forecast, we would see the brunt of the storm strike central and northern Wisconsin, as well as the Upper Peninsula of Michigan. Significant amounts would still impact portions of Minnesota and the Dakotas, but Wisconsin would receive the heaviest totals.

Tropical Tidbits
We'll next look over the forecast from the GFS-Parallel model, the newer version of the GFS model which will replace the current model in coming months. This GFS-Parallel model is rumored to be more accurate in multiple aspects of its forecasts, and this storm looks to be its first real test. The GFS-Parallel shifts the bulk of the snow east, now slamming the Upper Peninsula of Michigan into south-central Canada with those two-foot totals. Amounts in Wisconsin would still near 24", but not as widespread as the current GFS model shows. Minnesota is also forecasted here to receive heavier snow, extending into the Dakotas as well.

Regardless of which model you're looking at, the picture is clear: this storm will bring very heavy, very early-season snow to the Upper Midwest and North Plains.

WPC
The Weather Prediction Center issues probabilistic forecasts for snowfall amounts in a given period. In the above image, we see the WPC's forecast for the likelihood of 12" of snow falling in a 24 hour period, centered around November 11th. The WPC places the likelihood at around 50%, a value that's likely to rise as we get closer to the storm's impact and confidence increases.

To summarize:

- A significant winter storm is forecasted to affect the North Plains and Upper Midwest.
- Amounts nearing 24" may be expected, especially in Wisconsin and the Upper Peninsula of Michigan.
- Preparations for this storm should begin now.

Andrew

Tuesday, November 4, 2014

November 8-12 Potential Winter Storm

Model guidance appears to be toying with the idea of a winter storm in the November 8th-12th timeframe.

Tropical Tidbits
The image above shows the ECMWF model's forecast of mean sea level pressure (MSLP) contours and 850mb temperature values, valid for November 11th of next week. In this image, we see a strong storm system pushing north into western Illinois, dragging down sub-freezing air behind it only a few thousand feet off the ground. This 995 millibar storm would bring predominantly snow to areas north of the thin red freezing line, which would include Wisconsin and Iowa, among other regions.

I cannot post graphics due to copyright concerns, but this ECMWF run spits out over 12" of snow in parts of Wisconsin due to this storm. The ECMWF has shown this storm inconsistently for a few runs now, keeping uncertainty high.

Tropical Tidbits
The image above shows the GFS-Parallel model's forecast of MSLP values and 500 millibar geopotential height values, valid on November 10th. In this image, we see a messy set-up for this storm, with one low pressure system located in northwest Missouri, apparently attached to a very weak low pressure system in Michigan. This set-up would likely keep most snow out of the picture, save for the Upper Midwest, and is a plausible solution, given that this model will succeed the GFS model in due time.

This whole potential for a winter storm arises from what we saw happen in Japan a few days back.

PSU
The above image shows observed 500 millibar geopotential height anomalies over the Northern Hemisphere (left panel), as well as cloud cover and high/low pressure demarcations (right panel). Note how we saw a very strong storm stirring up near Japan on this date, which was November 2nd. We saw a strong trough wrap up and occlude just north of Japan, still bringing through a respectable shot of cold air. I had discussed earlier about how this could provide the basis for a potential winter storm, and it appears that this potential is being realized now.

Because this storm appears to occlude north of Japan, but still scrape the western side of the nation as it does so, I'm still content believing the risk for a winter storm remains. Just how great that risk is must be examined further, but the chance remains.

To summarize:

- Model guidance is indicating the potential for a winter storm to hit the Central US in the next week or so.
- Very high uncertainty exists with this storm potential.
- Depending on cold air availability, as well as if the storm actually happens, accumulating snowfall may be a concern.

Andrew

Sunday, November 2, 2014

November 24-30 Potentially Significant Winter Storm

It's becoming evident that we may be dealing with a potentially very strong Thanksgiving winter storm.

Tropical Tidbits
The image above shows the GFS model's combined forecast of 500mb geopotential height values (colored shadings) and mean sea level pressure (MSLP) contours over the West Pacific and north-central Pacific basins. High and low pressure demarcations are also seen. This forecast is valid on the evening of November 7th, and may have a significant effect on our weather here.

The potential for a significant winter storm evolves out of the Bering Sea for this forecast. The method, referred to as the Bering Sea Rule, takes the occurrence of high and low pressure events in the Bering Sea, and expects a similar weather phenomenon to occur in the US about 17-21 days later. This is almost exactly like the Typhoon Rule I commonly discuss when analyzing winter storm potentials, except now the area to watch is the Bering Sea, and the timeframe from occurrence in the Bering Sea to reciprocation in the US is now 17-21 days.

Getting back to this model forecast, we can see a very strong extratropical cyclone impacting the far western Aleutian islands, with a minimum central pressure of 930 millibars. If we utilize the Bering Sea Rule here, and extrapolate the forecasted time frame above of November 7th out seventeen to twenty-one days, we find ourselves with a potentially significant winter storm in a rough November 24-30th timeframe.

The evidence supporting this storm doesn't end here; we have a long way to go...

Tropical Tidbits
The model now shown above is the Canadian GEM forecast model, with the same 500mb geopotential height and MSLP contour parameters as the GFS model (for future reference, all model guidance we will analyze here today will use those 500mb and MSLP parameters). This forecast is valid on the afternoon of November 8th, nearly a day later than the GFS forecast above. Despite this time difference, we still see that very strong storm system from the GFS model now appearing in the GEM's forecast, with a minimum central pressure of 944mb spread across a heavy majority of the Bering Sea. Once again, this supports the prospect of a strong winter storm, if not solely a strong blast of cold air, to the US in late November.

Tropical Tidbits
Let's now examine the ECMWF model, commonly referred to as the most accurate weather model in the world at this time. The forecast panel above is valid for the evening of November 7th, and even though the storm hasn't reached the Bering Sea yet, its minimum central pressure is already down to whopping 930 millibars!

Tropical Tidbits
If we fast forward that same ECMWF model forecast up twenty-four hours to the evening of November 8th, we find that the storm system has gotten a bit stronger, and quite larger. The minimum central pressure is now down to 928 millibars, with the storm's influence spread from Russia to Alaska! The ECMWF model joins the GFS and GEM in supporting a strong winter storm for late November, possibly in time for Thanksgiving.

I could keep adding more and more model guidance projections to prove my point, but the general premise is already pretty clear by now. The three aforementioned models, in conjunction with the GFS-Parallel, ECMWF ensembles, and GFS Ensembles are favoring a very strong storm system in the Bering Sea for around November 7th or 8th.

The next question becomes, who could it target?

Well, if these model forecasts do verify as they appear now (which is nowhere from certain), each model projection would hit a difference part of the nation. The forecast members with the storm further west in the Bering Sea would find the Thanksgiving storm system in the Central US, while the model guidance members further east into the middle Aleutian Islands (or even further east) would likely find the consequential Thanksgiving timeframe storm in the East US, possibly along the coast.

Because this potential storm is still over 7 days away from appearing in the Bering Sea, and thus guidance can be expected to change with uncertainty, it's not worth putting down an accurate estimate as to where the storm may hit. However, just glancing over trends from these three shown models, as well as others available, would only slightly support more of a Central US/inland East US storm system.

To summarize:

- Model guidance is favoring a very strong storm to hit the Bering Sea in the next few days.
- If this storm ends up as strong as projected, it may result in a very strong winter storm around the Thanksgiving timeframe.
- A lot of uncertainty exists with this storm at this time.

Andrew

Thursday, March 20, 2014

March 25-27 Potentially Significant Blizzard

I'm watching the potential for a potentially significant snowstorm that model guidance believes will become a blizzard.

The image above shows 500mb geopotential height anomalies from the latest run of the GFS model over the Western Pacific, valid for March 20th. As this image shows, we see strong negative height anomalies present over Japan on March 20th, indicative of a rather strong storm over the area. There is a rule, well explained by Joe Renken, that states a weather phenomenon in East Asia will be reciprocated in the United States 6-10 days later. This means that if there is a storm system in Japan on a certain day, we can expect a storm in the US 6-10 days after that. The same goes for high pressure and warm weather. So, if we take this March 20th storm and move it ahead 6-10 days, we find a potential storm system around the March 26th through 30th period.

Let's take a look over current model guidance. Shown above is the latest forecast from the Canadian GGEM model, valid on March 26th. We see an extremely strong storm system positioned just offshore of the Northeast, dumping heavy precipitation on the order of over 12" on inland areas, with multiple FEET of snow falling on coastal locations. The GGEM model has already been shown to be suffering from convective feedback issues on this run, meaning precipitation amounts are grossly exaggerated and incorrectly altered due to this specific bias. Thus, this forecast run is overdoing precipitation amounts and is not correct in its forecast at this time. What I do agree with, however, is placement of the storm. We look to be in a northwest flow regime, a pattern notorious for providing a very favorable environment for East Coast snow events, and we'll discuss this a bit later.

We now move on to the ECMWF model, which also shows a very strong storm system displaced just east of the Northeast coastline. This is of similar strength to the GGEM model and would likely be putting down some pretty darn heavy snow amounts, but because we lost access to the main provider of our weather maps, we can't give an indication as to just how severe this storm looks to be on the ECMWF. However, once again, we're seeing this strong storm in the midst of a northwest flow pattern, as we see the dashed lines dropping down to the southeast from Canada. This is crucial to the forecasts of a strong East Coast storm.

The American GFS model is far less enthusiastic about this storm, only putting down modest precipitation along the coastline and sparing inland regions from any accumulating precipitation, snow or otherwise. This is considered the outlier forecast when taking into account how the GGEM, ECMWF and ECMWF Ensembles believe we'll see a strong East Coast-hugging storm, but in the grand scheme of things, there is high model agreement on a storm at least threatening the East Coast in this timeframe, and that's what we're looking at here.

Take a look at this graphic above. This image shows a few things important. The main item we see first are the negative 500mb and positive 500mb anomalies, marked by contour lines in blue and red, respectively. Just glancing over the image, we find a sustained northwest flow scenario unfolding, with deep negative height anomalies pressing into the East US, with high pressure surging northward in the West US. The second item we need to discuss are the dates on the bottom right hand corner. They are analog dates, listed from top to bottom, and the date at the top means its pattern is most similar to the pattern forecasted in the graphic itself, which is valid around the March 26-30 period, right on top of the timeframe outlined for this potentially significant storm. Look closely at the dates- are you picking up on one particular date in that list? If not, check out the second date from the top. That pattern was deemed to be the second most similar to the pattern expected to unfold as this storm system impacts the East US. And that date - March 16, 1993 - spawned the 'Storm of the Century'.

Now, there are some who are anticipating another Storm of the Century because its date has shown up on these analog images, and they might tell you to prepare for feet of snow. All that we know now is that model guidance is hinting rather consistently at the potential for an all-out blizzard in the East US, specifically the Northeast. As of right now, there is disagreement on who could get hit by the storm, and there's even disagreement on if there'll be a storm at all. As of now, the potential for a significant storm is rather high due to the East Asian correlation, but it remains to be seen if this could be a blizzard for the East Coast, hence all the caveats throughout the post.

Andrew

Monday, March 10, 2014

Impending Snowstorm to Drop 12"+ of Snow Tuesday and Wednesday

Note: This post will concern the March 11-14 Significant Snowstorm, but the title has been changed. If you find this sort of title better than the date and storm classification, or if you prefer the date + classification, leave your input in the comments below.

I'm carefully watching the next few days for a snowstorm that looks to drop a foot of snow or more on the United States.

We'll begin with an analyzation of the big picture of this storm. The model I will be using here will be the NAM model, as its low-resolution GFS counterpart appears to be suffering from some errors we will address later on in this post. The image above shows mean sea level pressure (MSLP) values, as well as precipitation values and high and low-pressure demarcations for Tuesday afternoon, tomorrow. We see a strong storm system in the far northeast corner of Kansas, bottoming out at 994 millibars and creating a heck of a pressure gradient over Nebraska. In Nebraska, we also see a precipitation shield breaking out, which could be accompanied by some harsh winds if that pressure gradient happens to meet up with the precipitation. Luckily, this forecast keeps the strongest winds just south and east of the inclement weather in northwest Nebraska.

In the late evening hours of Tuesday, we see that our storm system has pushed off to the east, maintaining both its tight pressure gradient and precipitation shield as it progresses east. Our storm is now at about 995 millibars, roughly the same strength as what we saw Tuesday afternoon in the image above. The 1 millibar difference really isn't anything to write home about in this situation. Typically, we might see a severe weather situation arising in the Plains and Midwest due to that tight pressure gradient, but that swath of precipitation down in Mississippi, Alabama and the panhandle of Florida indicate there's a storm system there (a closed low, to be exact) that will prohibit such a severe weather event from forming. At this point in time, accumulating snow should begin to fall over the Midwest.

By the time we hit the morning of Wednesday, March 12, we find that phasing has occurred with our storm system. What this means is that our original system has phased, or merged, with a system coming south from Canada to create a single, stronger storm. This is clearly displayed by the abundant precipitation breaking out over Michigan, Indiana and Ohio, and also shown by the tighter pressure gradient expanded across much of the Central and East US. It is also possible the western flank of the gradient is a bit amplified thanks to the strong high pressure in Canada, but that's not a big piece of the puzzle right now. At this point in time, potentially significant accumulating snow looks to be impacting the Ohio Valley.

Lastly, by the evening hours of Wednesday, we see the system has now transferred offshore, and is now putting down significant accumulating snow across the interior Northeast, leaving coastal areas (and even some inland regions) to experience rain or a mixing event.  The extreme pressure gradient remains in place, maximized in this forecast graphic over Pennsylvania and New York, as well as the rest of the New England area. After this, the storm exits the region, leaving quite a snowstorm in its wake. Check out the latest snowfall forecasts for this event:

To add some model variety, we'll also show the GFS snowfall forecast.

If you look at these maps and think something's not the same, you're right. There are some differences here. The primary difference is that the GFS is more south with the storm system than the NAM model. This is displayed well when looking at the beginning of the accumulating snow swath all the way back out in Illinois. The NAM model gives a generous 6" or more to Chicagoland, but the GFS only lays down a handful of inches across Springfield, IL.

After looking at all the data, I think it might be best to lean towards a NAM solution with the placement of heavy snow further north in the Great Lakes, but not too far north, if you know what I mean. Let's go over why.

The first red flag is the NCEP Weather Prediction Center's preferred track superimposed on an ensemble suite for this storm system. We see the NCEP WPC track for this storm in black, but it's obvious that their track is on the southern envelope of guidance. The heavy majority of ensemble members prefer to take this storm further north, into central or northern Missouri rather than southwestern MO. This would result in snow totals displaced further to the north, like the NAM says. But we can dig deeper than this. Let's keep going in our search for why these northern amounts are more preferred over the GFS.

Let's take a close look at the image above. Here, we see the NAM model projecting 300mb wind speeds in color shades and wind barbs, valid early Wednesday morning. If you look closely, you can spot two distinct jet streaks, or two areas of stronger winds than the winds around them. These are shown best by the yellows in Oklahoma and Kansas, as well as in far northern New England. These two jet streams form the classic coupled jet stream, as defined by Uccellini and Kocin in their studies. This coupled jet stream idealizes that there is a space between two jet streaks, where heightened divergence is found. In other words, in the space between two jet streaks, the atmosphere wants to create more precipitation. So, if we look above for the space between these two jet streaks, we can draw a line roughly from Missouri to Lake Michigan of where this increased divergence, or increased precipitation would be expected to appear. This would seem to put the NAM's snowfall placement 'in the right' when compared to placement of the GFS snow totals, at least in the Great Lakes region.

Also, take a look at what the 18z GFS does with the storm as it moves along the Ohio Valley.


If you watch the low pressure denotation as it moves from Indiana, it goes to the southeast rather than to the east. You might not think this is so odd, but when you compare it to the agreed notion that this storm will be moving west-to-east, a southward movement is rather odd.

Additionally, a convective feedback issue was observed as the system crossed east through Indiana, likely hampering the forecast for this storm. In this case, you may want to defer to the 12z GFS, as it is more logical in comparison to this run.

To conclude, a significant winter storm is expected for a good chunk of the US. Model guidance differs on placement of the snow, mainly in the Great Lakes, but it is agreed on that the Northeast will see a substantial snowstorm.

Andrew