Thursday, February 12, 2015

Anomalous Upper Level Low to Deliver Intense Cold in East US

An anomalous upper level low connected to the swirling mass of cold air in the Arctic looks to deliver a punch of brutally-cold air, impacting the East US the strongest.

PSU
Click images to enlarge
The above image shows the GFS ensemble mean spread forecast for the 500-millibar field on the top panel, with increased spread/uncertainty among ensemble members shown by shaded colors. That spread can also be seen in the individual member colored lines. The bottom panel shows anomalies for the 500-millibar field, with cool colors indicating negative anomalies, and warm colors depicting positive anomalies.

In this image, we note a strong upper level feature pushing south from Canada, with anomaly values reading 3.27 units below normal, maximized in western New York into western Pennsylvania as the purple colors show. Judging by the numerical denotations on that bottom panel, 500-millibar values could flirt with the 500-dm benchmark along the US/Canada border, indicative of a very strong (and very cold) upper level low.

Tropical Tidbits
Forecasts from computer models suggest sub-zero temperatures will be the theme throughout a significant swath of the North US. Latest guidance suggests temperatures in west New York and Pennsylvania will easily drop below -10 degrees Fahrenheit, with some locations getting very close to -20 degrees F. Locations further to the west, particularly in the Midwest and Great Lakes, may also come close to -15 degrees, with some areas dropping down to that -20 degree F benchmark. All in all, this is looking dangerously cold, potentially life-threatening.

To summarize:

- The first part of a multi-wave cold blast looks to impact the North US this weekend.
- Cold weather will be maximized in the Northeast, where temperatures could reach lows of -20 degrees Fahrenheit.
- Travel is strongly advised against due to the life-threatening nature of this cold air.
- Make sure to seek out assistance now for neighbors, friends, and/or family that may have trouble sustaining heat in their homes, or could be adversely affected by this cold.

Andrew

Long Range Outlook (Made February 12, 2015)

This is the Long Range Outlook, valid for the middle and end of February into the start of March.

PSU
Ensemble guidance close to 9 days out from today shows a pattern highly conducive to cold weather across North America. We see a strong ridge positioned across the west coast of North America, pushing into Alaska. The alignment of this ridge closer into the Gulf of Alaska as opposed to along the shoreline indicates a negative East Pacific Oscillation (EPO) pattern. This sort of pattern allows for sustained northwest flow (winds out of the northwest) in the Central US, and this is well shown by the strong upper level low buckling south into the Great Lakes. Short range projections show very cold temperatures slamming much of the nation, hitting the northern Ohio Valley and Northeast very hard in particular. This cold pattern looks to be enhanced by some ridging, albeit suppressed, south of Greenland. I am concerned that the ridge not being positioned closer to Greenland could make this cold weather more progressive and not as long-lasting as current ensembles are making it out to be, though those details can be sorted out further down the road. For now, the opening days of this 7-31 day forecast period are looking very cold.

PSU
By Hour 348, which is about 14 days out from today, we see a shifting of the members mentioned above to the west. Our negative EPO ridge has now been shunted west, and now occupies the Bering Sea into waters to the southwest. The strong upper level low still remains on our side of the hemisphere, but the core of this low has been retracted into the North Atlantic, with a leg of negative height anomalies stretching out to the Rockies. As a result, the general idea is that more progressive flow can be expected as we round out February, which should be able to moderate any cold blasts near the end of the month. We also see ridging coming up offshore of the East Coast, which could put an end to what looks to be an incredibly cold and snowy February for millions in the East.

Albany
We now turn to tropical forcing to help us identify the pattern for the beginning days of March. Looking at the bottom panel, we see a significant swath of enhanced tropical convection blossoming just south and east of the subcontinent of India, depicted by the deep blue shadings. If we match the positioning of these anomalies to the eight phases of the Madden Julian Oscillation, we can expect the emergence of a Phase 3 or Phase 4 event, as the composite chart below shows.

BOM
Generally, Phase 3 events support cooler than normal temperatures in the United States, while Phase 4 composites indicate warmth prevails across the country. Purely due to how February looks to shape up, I would favor a chillier outlook to kick off March. This method of persistence forecasting tends to work well, particularly when the pattern seems to 'lock in' to a certain temperature alignment; in this case, a cold Central and East US, with warmth in the West.

CPC
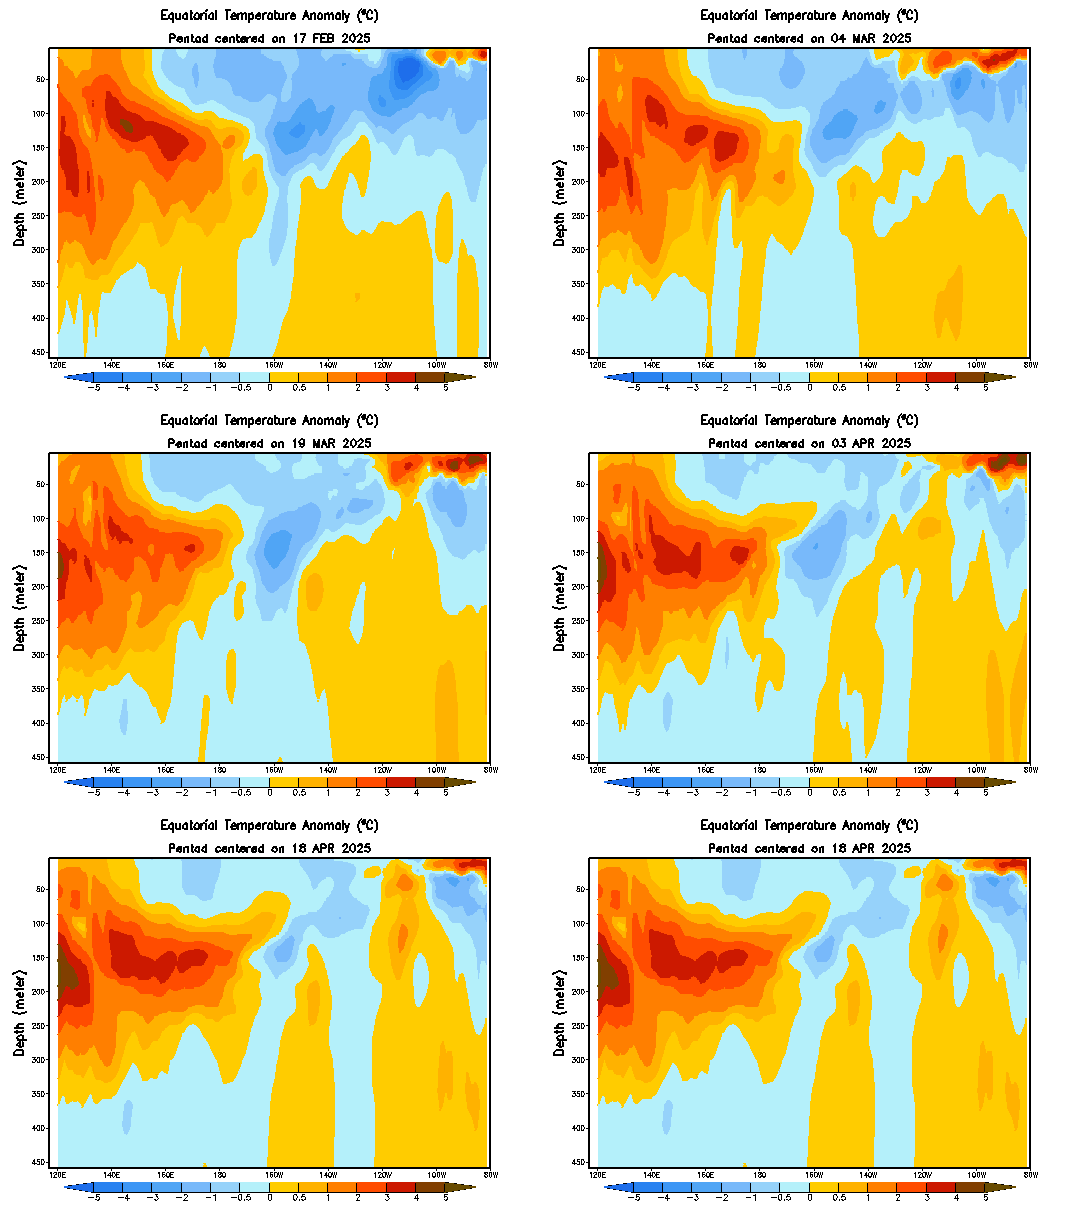
Looking even further out, just for kicks, let's go over sea surface temperature anomalies, under the surface. Anomalies show the 'warm part', the upwelling phase of a Kelvin wave moving eastward at a depth of about 100 to 200 meters. We're currently seeing the 'cold part' of that Kelvin wave, the downwelling phase, hitting the surface from about the 100 west longitude line on eastward. The warmth from the upwelling is already at the surface in the Central Pacific, and this could be setting up a more El Nino-like pattern. I personally find this to be plausible, as El Nino winters are notorious for a slow start and furious end, as we're seeing in real time right now in the East US.
In springs with an El Nino, temperatures in the North US will generally be warmer than normal, while the opposite scenario plays out in the South, with colder than normal temperatures. It remains to be seen if this will play out in the March-April-May period, but it'll be something to watch.

To summarize:

- A very cold pattern will unfold over the next 7-14 days.
- There are hints of a warmer pattern coming around for the period beyond 14 days, but this needs to be watched for potential failure.
- It is expected that the East will remain overall below normal throughout the entire period in temperatures. A similar story, though not as cold, may be expected in the Central US.
- Snowfall should favor the East US in this entire pattern, though a shift to a more inland track could occur in late February if model guidance ends up being correct.

Andrew

Saturday, February 7, 2015

February 22-27 Potential Winter Storm

Model guidance has been hinting at a rather strong winter storm impacting the United States around a February 22-27 period.

Tropical Tidbits
Click images to enlarge
The above image shows the GFS forecast of 500mb geopotential height values (colored shadings) and mean sea level pressure contours over the West Pacific, valid on February 16th. In this image, which is from the GFS model run on the morning of February 4th, we see a very strong low pressure system crossing Japan and moving away from the country as it does so, with a minimum central pressure here of 987 millibars. This is a very strong system, but one might argue that can be expected from long range guidance, which can/does tend to over-amplify storms in long-range forecasts.

Since that forecast was made, at least 5 other GFS runs came in with very similar solutions, meaning this could be a valid storm potential. You'll notice that the timeframe isn't exactly the same on each graphic, but the storm impacting Japan between February 16-17 is generally agreed upon.

Tropical Tidbits

Tropical Tidbits

Tropical Tidbits

Tropical Tidbits

Tropical Tidbits
While this model remains inconsistent as far as showing this storm run-after-run, the general concept of a storm in this timeframe is still present (for now).

When we apply the Typhoon Rule, which states weather phenomena occurring in Japan is reciprocated in the United States 6-10 days later, we can extrapolate the storm in this February 16-17 timeframe to get a rough estimate of a February 22-27 correlation here in the US, padding in a couple days for uncertainty. But we may also be able to figure out where it tracks.

ESRL
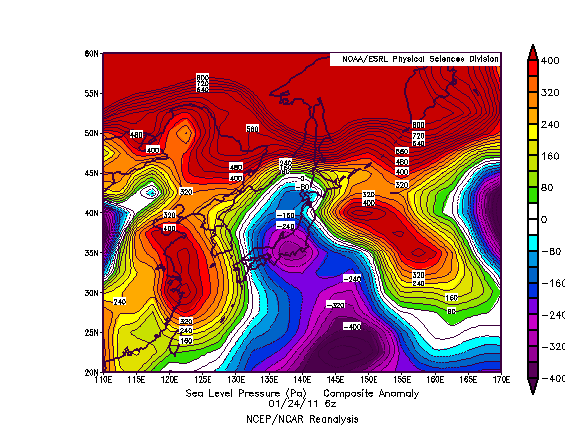
The above image shows sea level pressure anomalies on the morning of January 24th, 2011. On this day, we saw a storm system cross Japan and rapidly strengthen as it began to exit the eastern coast of this country. Just for kicks, let's apply the Typhoon Rule here. If we do so, we likely saw a storm system impact the country between January 30th and February 3rd, 2011.
Some of you might remember that as the Groundhog Day Blizzard of 2011, which dropped close to 24" of snow in Chicago, IL, as well as incredible ice accumulations in the cold sector of this storm. When we compare the projected track of our mid-February storm in the GFS images above, we see that some (not all) forecasts have the upcoming low taking a similar track as the eventual-Groundhog Blizzard did. That's not to say I'm expecting another massive blizzard. I'm just trying to show where this storm could end up tracking, and that could be through the Midwest yet again.

Tropical Tidbits
There's also the chance we see this storm go through the East US and impact that area primarily. The reasoning behind this is the expected ridge-out-west and trough-out-east pattern which will likely deliver more than one round of accumulating snow to the East (more on this can be found in yesterday's post). The image above shows the GFS ensemble outlook at the very end of its run, depicting 500-mb geopotential height anomalies for February 22, 2015. We see a gradual departure of the trough in the East into Greenland, though the ridge in the West is still persisting. Personally, I'd bet more on the trough staying put purely out of persistence forecasting, but that's why you take model guidance with your own opinion. If this forecast did work out, however, the storm could impact the Central US and East US, whereas the trough staying put would result in an impact likely for the East.

CPC
If we factor in tropical forcing, we get yet another different picture. When the timeframe for this storm rolls around, enhanced tropical convection is forecasted (not shown here) to be placed in an area around and just east of the 90ยช East longitude line, which places us in Phases 4 or 5 of the Madden-Julian Oscillation (MJO). The above graphic shows precipitation anomalies on the left two columns; we'll ignore the colorful columns on the right for now. When we look at precipitation anomalies during Phase 4 and 5 in a January-February-March period, we tend to see the Central US into the Northeast getting in on storm activity. This could mean the storm in late February, if it happens to begin with, will hit both the Central US and East US, but anything beyond that is purely guessing.

To summarize:

- There are indications a strong storm could hit Japan in the middle of February.
- This could result in a strong storm in the United States between February 22 and February 27.
- It is not known who will/could be affected by this system yet.
- As the post thoroughly showed, significant uncertainty surrounds this event.

Andrew

Friday, February 6, 2015

Upcoming Pattern Very Favorable for East Coast Snowstorms

The upcoming pattern appears to be very favorable for snowstorms along the East Coast.

Tropical Tidbits
The above image shows the 500mb geopotential height anomaly field over North America, forecasted by the GFS Ensembles from February 11th to February 16th. In this graphic, we see a strong upper level low dipping down over the Bering Sea, forcing a strong ridge to blossom along the Western US. A Rex Block then forms in the Southwest, as an upper level low slides under the ridge. Usually, a Rex Block upstream creates zonal flow downstream, but instead of rather calm weather in the East US, we see a deep upper level low pushing its way into the Northeast. This looks to be the pattern for the next 2 weeks or so.

In this sort of pattern, sustained northwest flow (winds from the northwest) often leads to a 'clipper train', where a multitude of Alberta Clippers slides southeast-ward into the Central US. These clippers can then move east off the coast, and can intensify to produce heavy accumulating snow for the East US. I believe that this is a possibility, and could happen more than once in the next couple of weeks.

Unisys
A look at sea surface temperatures shows how potent this environment is. For now, we'll focus on the East Coast. Notice all the oranges and reds immediately along the coastline, extending a bit east. Those are very warm waters, with well-above normal anomalies being detected. Consequentially, any clippers that move off the coast and threaten the East will have unusually warm waters to work with, which could very well enhance snowfall totals.

To summarize:

- The upcoming pattern is favorable for accumulating snowfall in the East US.
- This pattern may support more than one event of plowable snow.
- Extreme cold may affect the Northeast, at times.

Andrew

Tuesday, February 3, 2015

February 16-20 Potential Arctic Outbreak

There appears to be the risk of an outbreak of cold air between a February 16-20 period.

Tropical Tidbits
The image above shows 500mb geopotential height anomalies over the West Pacific, forecasted by the GFS model and valid on the morning of February 10th. In this image, we see a very strong upper level low displaced just north of Japan, with contours telling me this is a sub-500dm upper level low- a very strong storm. When we use the Typhoon Rule, which states weather phenomena occurring in Japan is reciprocated in the United States 6-10 days later, a strong upper level low could approach the United States from the north in a February 16-20 period. It's too early to tell definitively, but this could correlate to a lobe of the tropospheric polar vortex plummeting south towards the mid-latitudes. Again, it's too early to tell right now.

ESRL
Long range ensemble forecasts for the middle of this timeframe are already beginning to see strong upper latitude blocking leading to a new wave of cold weather for the Central and East US, as those blue colors shown over North America. We will need to watch upcoming forecasts to see how they change.

ESRL
For comparison, here's the chart of 500mb geopotential height anomalies over Japan on December 27th, 2013. We saw a very strong upper level low drop south into southern Japan, which then correlated to the infamous cold blast which originally made the phrase 'polar vortex' go viral. Forecasts above don't see the impending upper level low dropping as far south, which is why I'm thinking this upper level low will approach the region, and not necessarily induce a period of incredibly frigid temperatures, like we saw last winter.

To summarize:

- A strong upper level low looks to drop south to scrape northern Japan in the next week.
- As a result, we could see a period of below-normal, possibly well below-normal temperatures between February 16th and February 20th.

Andrew