I had been heralding this winter as one that would vindicate the winter (or lack thereof) of 2011-2012. I explained how multiple atmospheric factors were supportive of a much better pattern for cold and snow across the nation. But that never materialized. Today, on February 10, 2013, much of the nation is again well below normal on winter snowfall. It's time to see where I went wrong.
The first thing we must review is the El Nino-Southern Oscillation, or ENSO index. This index tracks the anomaly of sea surface temperatures in the Equatorial Pacific. Above normal temperatures are known as El Nino's, and below normal sea temperatures are referred to as La Nina's. This winter, the eastern Equatorial Pacific did not have a specific water anomaly. It was neither above or below normal. This is called a Neutral ENSO situation. In Neutral winters, the atmospheric pattern is much harder to figure out. The ENSO stage really drives the overall pattern of each winter, so a neutral ENSO winter means the forecasts become much harder to predict, as we observed this winter. Due to a lack of a defined ENSO stage, more mesoscale patterns are left to drive the winter, and we observed this with the unfavorable Pacific pattern ruining winter.

500 millibar height anomalies over the last 60 days are pictured above, where reds are high pressure and blues are low pressure. Purple defines no anomaly. This winter's lack of snow can be blamed on the pattern in the Pacific Ocean. We saw low pressure dominating the Bering Sea too often to be comfortable, and this low pressure anomaly then led to low pressure on the West Coast of the US. In response to low pressure in the West Coast, high pressure then had to form in the East US to balance out the 500mb height anomalies. Strong high pressure was then encouraged to form in the north central Pacific. This was sort of a good and bad thing. At times, this high pressure was able to provoke a more favorable Pacific pattern. At other times, it provided the base for the anti-snow Rex Block formation on the West Coast.
Taking a look up towards Greenland, we find a very favorable last 60 days. High pressure tended to stick around that region, which is called a negative North Atlantic Oscillation (NAO). In the negative NAO, high pressure forms in Greenland and storms tend to follow the Nor'easter track. Cold weather is encouraged in the Northeast as well. If you're now wondering why that didn't all occur with such a favorable negative NAO, just look at the Pacific and there's your answer.
This Pacific pattern can also be blamed on the negative Pacific Decadal Oscillation, or PDO. In a negative PDO, colder than normal water temperatures are present in the Northeast Pacific. This encourages low pressure formation in that area, which can then shift onshore into the West US. This onshore shift creates that low pressure in the West, high pressure in the East situation that we discussed earlier. I did make a note of it on my final winter forecast (click here), but did not emphasize it enough. It is clear that, had I put more emphasis on the negative PDO, my forecast would have been milder and thus more accurate of this winter.
These were my two analog packages for the winter of 2012-2013. I used winters that had a weak/moderate El Nino after 2 La Nina's. This was before it was clear that there was not going to be an El Nino and that there would be a Neutral ENSO state instead. My precipitation analog image (top) turned out to be a solid failure. My analogs predicted below normal precipitation in the Ohio Valley and Midwest. That did work out in most areas, but a spot of above normal precipitation in North IL and parts of Indiana didn't make it as accurate as I wanted it to be.
 My temperature analog forecast, pictured above, was a massive bust. Warmer than normal temperatures prevailed across basically the entire nation for January, with the Ohio Valley and Midwest getting the worst of it. The Northern Plains didn't even work out for December- that region was slightly below normal. Although the January data isn't in yet, I have a feeling above normal temperatures will be across the board once again, further hurting my analog years' forecast.
One big component I was counting on to really bring in the cold for the nation was Siberia. As many of you may or may not know, snow cover anomalies in Siberia during the month of October can help predict the following winter's temperatures over North America. You see, these snow cover anomalies then have implications on the Arctic Oscillation. If half of the month of October had below normal snow cover, one would expect the first half of the following winter to have a positive Arctic Oscillation (a.k.a. warm temperatures). In October 2012, we had very below normal snow cover for the first half of the month. This actually did correlate nicely with that part of my winter forecast, which called for a warm December into January. However, the back half of October had very above normal snow cover, and made me think that the last half of January and all of February would be colder than normal for the US. Well, we did get some better shots of cold air, but the pattern was (and still is) too progressive to entrench any solid cold air. I think this part of the Siberian-based forecast will fail for February.
If I were to rate my winter forecast thus far, with all variables used in my forecast considered and my forecast for the rest of February included, I would have to grade this as a D on the basic school grading system. I feel that the success with December from Siberia pushed it up from an F, but other than that nearly everything else went haywire and did not end as I had expected.
I am not quitting my long range forecasting, this is just one of those years. We look to have a new ENSO state going into summer, so that could very well help in the winter of 2013-2014.
Comments and feedback are appreciated below, whether they be positive or negative. I will allow comments both opinions, but will not accept comments with over-the-top positive or negative feedback.
Andrew
The first thing we must review is the El Nino-Southern Oscillation, or ENSO index. This index tracks the anomaly of sea surface temperatures in the Equatorial Pacific. Above normal temperatures are known as El Nino's, and below normal sea temperatures are referred to as La Nina's. This winter, the eastern Equatorial Pacific did not have a specific water anomaly. It was neither above or below normal. This is called a Neutral ENSO situation. In Neutral winters, the atmospheric pattern is much harder to figure out. The ENSO stage really drives the overall pattern of each winter, so a neutral ENSO winter means the forecasts become much harder to predict, as we observed this winter. Due to a lack of a defined ENSO stage, more mesoscale patterns are left to drive the winter, and we observed this with the unfavorable Pacific pattern ruining winter.
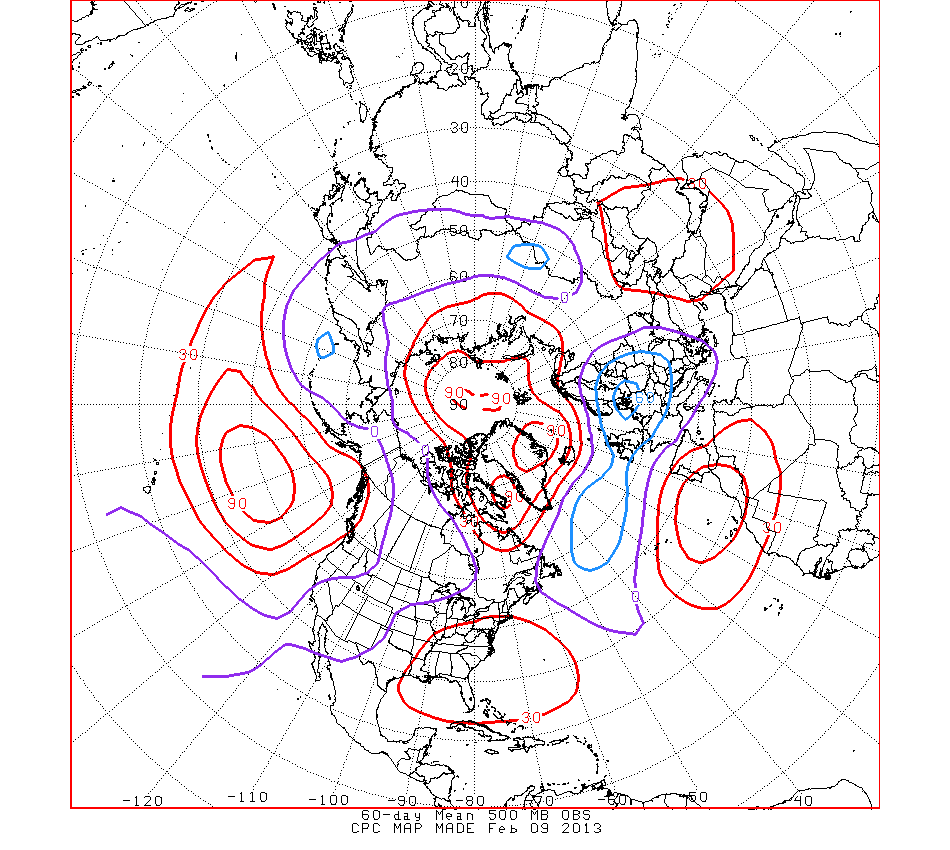
Taking a look up towards Greenland, we find a very favorable last 60 days. High pressure tended to stick around that region, which is called a negative North Atlantic Oscillation (NAO). In the negative NAO, high pressure forms in Greenland and storms tend to follow the Nor'easter track. Cold weather is encouraged in the Northeast as well. If you're now wondering why that didn't all occur with such a favorable negative NAO, just look at the Pacific and there's your answer.
This Pacific pattern can also be blamed on the negative Pacific Decadal Oscillation, or PDO. In a negative PDO, colder than normal water temperatures are present in the Northeast Pacific. This encourages low pressure formation in that area, which can then shift onshore into the West US. This onshore shift creates that low pressure in the West, high pressure in the East situation that we discussed earlier. I did make a note of it on my final winter forecast (click here), but did not emphasize it enough. It is clear that, had I put more emphasis on the negative PDO, my forecast would have been milder and thus more accurate of this winter.
 |
| Analog years for Precipitation |
 |
| Last 90 Days percent of normal precipitation |

One big component I was counting on to really bring in the cold for the nation was Siberia. As many of you may or may not know, snow cover anomalies in Siberia during the month of October can help predict the following winter's temperatures over North America. You see, these snow cover anomalies then have implications on the Arctic Oscillation. If half of the month of October had below normal snow cover, one would expect the first half of the following winter to have a positive Arctic Oscillation (a.k.a. warm temperatures). In October 2012, we had very below normal snow cover for the first half of the month. This actually did correlate nicely with that part of my winter forecast, which called for a warm December into January. However, the back half of October had very above normal snow cover, and made me think that the last half of January and all of February would be colder than normal for the US. Well, we did get some better shots of cold air, but the pattern was (and still is) too progressive to entrench any solid cold air. I think this part of the Siberian-based forecast will fail for February.
If I were to rate my winter forecast thus far, with all variables used in my forecast considered and my forecast for the rest of February included, I would have to grade this as a D on the basic school grading system. I feel that the success with December from Siberia pushed it up from an F, but other than that nearly everything else went haywire and did not end as I had expected.
I am not quitting my long range forecasting, this is just one of those years. We look to have a new ENSO state going into summer, so that could very well help in the winter of 2013-2014.
Comments and feedback are appreciated below, whether they be positive or negative. I will allow comments both opinions, but will not accept comments with over-the-top positive or negative feedback.
Andrew