Tuesday, January 8, 2013

Where Could The Polar Vortex End Up?

The latest ECMWF model forecast from Europe is showing the polar vortex (what makes the Arctic as cold as it is, not including the presence of a tundra landscape) sitting over Nova Scotia, Canada and the Canadian Maritimes. This solution would bring incredible cold and wind to the Maritimes, while a negative NAO rages, high pressure builds over the Arctic and a sliver of energy still remaining in Canada tries to build the vortex back up. What an incredible solution this would be if it verified.

But the truth is, models are horrible at handling pattern changes, so it's best we turn to ensemble forecasts.


The top image shows the ECMWF Ensemble prediction system, commonly called the ECMWF EPS (or just EPS for short) forecast at 10 days, and the GFS Ensembles (GEFS) are shown on the bottom, also valid 10 days out. These forecasts are showing 500 millibar height anomalies, where low pressure is shown in cool colors and high pressure in warm colors. Both ensemble sets agree on the polar vortex dropping down into Canada enough to bring the North US some serious cold, but nothing historic (nothing historic has been expected thus far- just serious, harsh cold). I feel like this will be a long-lasting event, with the sudden stratospheric warming's effects lasting for a couple weeks. This means, rather than one big cold shock, it appears possible that waves of cold will penetrate the nation, each wave spreading more and more cold around.

This is still a while away and the models remain without a consensus, so I will be updating you on the possibilities as this forecast time comes closer.

Andrew

Incredible Sudden Stratospheric Warming Event Ongoing

An incredible Sudden Stratospheric Warming (SSW) event is ongoing at this time, and latest observations around the stratosphere have historic values in the upper stratosphere and off-the-charts warmth being observed.

We start now with an animation of observed 10 millibar temperature anomalies. You can see how this SSW develops off the Himalayas and explodes around December 26th. In the last days of 2012, it begins to shift towards the Arctic, and we are now at a point that we have a historical sudden stratospheric warming ongoing. Why is it historic? See the chart below:

This chart shows 10 millibar observed temperatures for 2012 and 2013. You can see this immense SSW event shown on this chart on the red line. The dashed green line signifies the average conditions in the stratosphere for that time of year, while the gray lines show the highest or lowest value the temperature was at for any year between 1979 and 2008. If you look closely at where the red line is now, you can see it has broken through that gray line, and has thus set a new record for warmest stratospheric temperature for this day/few days at the 10 millibar level. Looking ahead to the next few days ahead of the red line we see higher records of stratospheric warmth, meaning the SSW will have to be stronger to set more records. Is it possible? Of course- the warming only reached the Arctic today, even though the animation goes up to January 6.

The scope and intensity of this SSW is displayed in the latest observed temperature image from the North Hemisphere at the 20 millibar level, not far from the 10mb level.


The colors show temperatures in the 20mb level of the stratosphere. Because this is a sudden stratospheric warming, we will see warm temperatures come up in the phenomenon's presence. The large swath of black depicts off-the-charts warmth being observed in the Bering Sea and North Asia. The pressure lines indicate the polar vortex has already suffered a split in the upper stratosphere, with two areas of tightened circles showing up in Canada and Europe. This is keeping the ball rolling with my severe cold prediction for Late January.

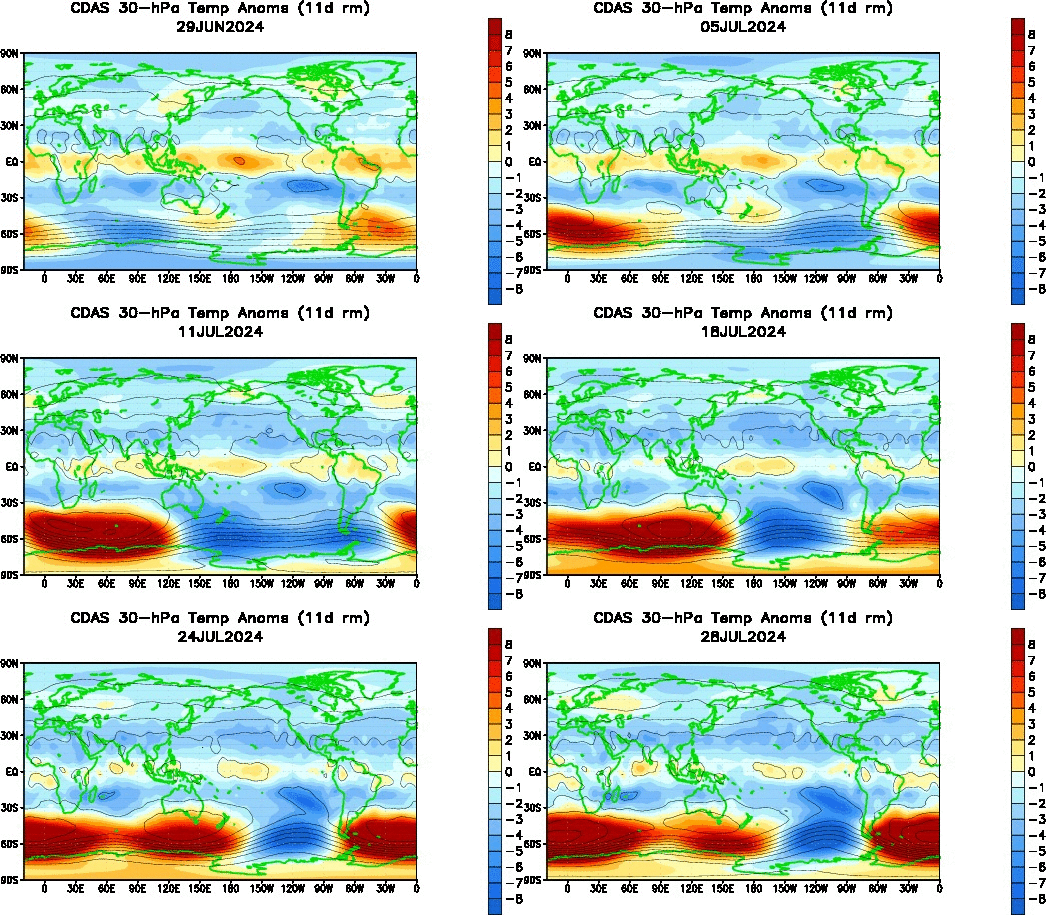
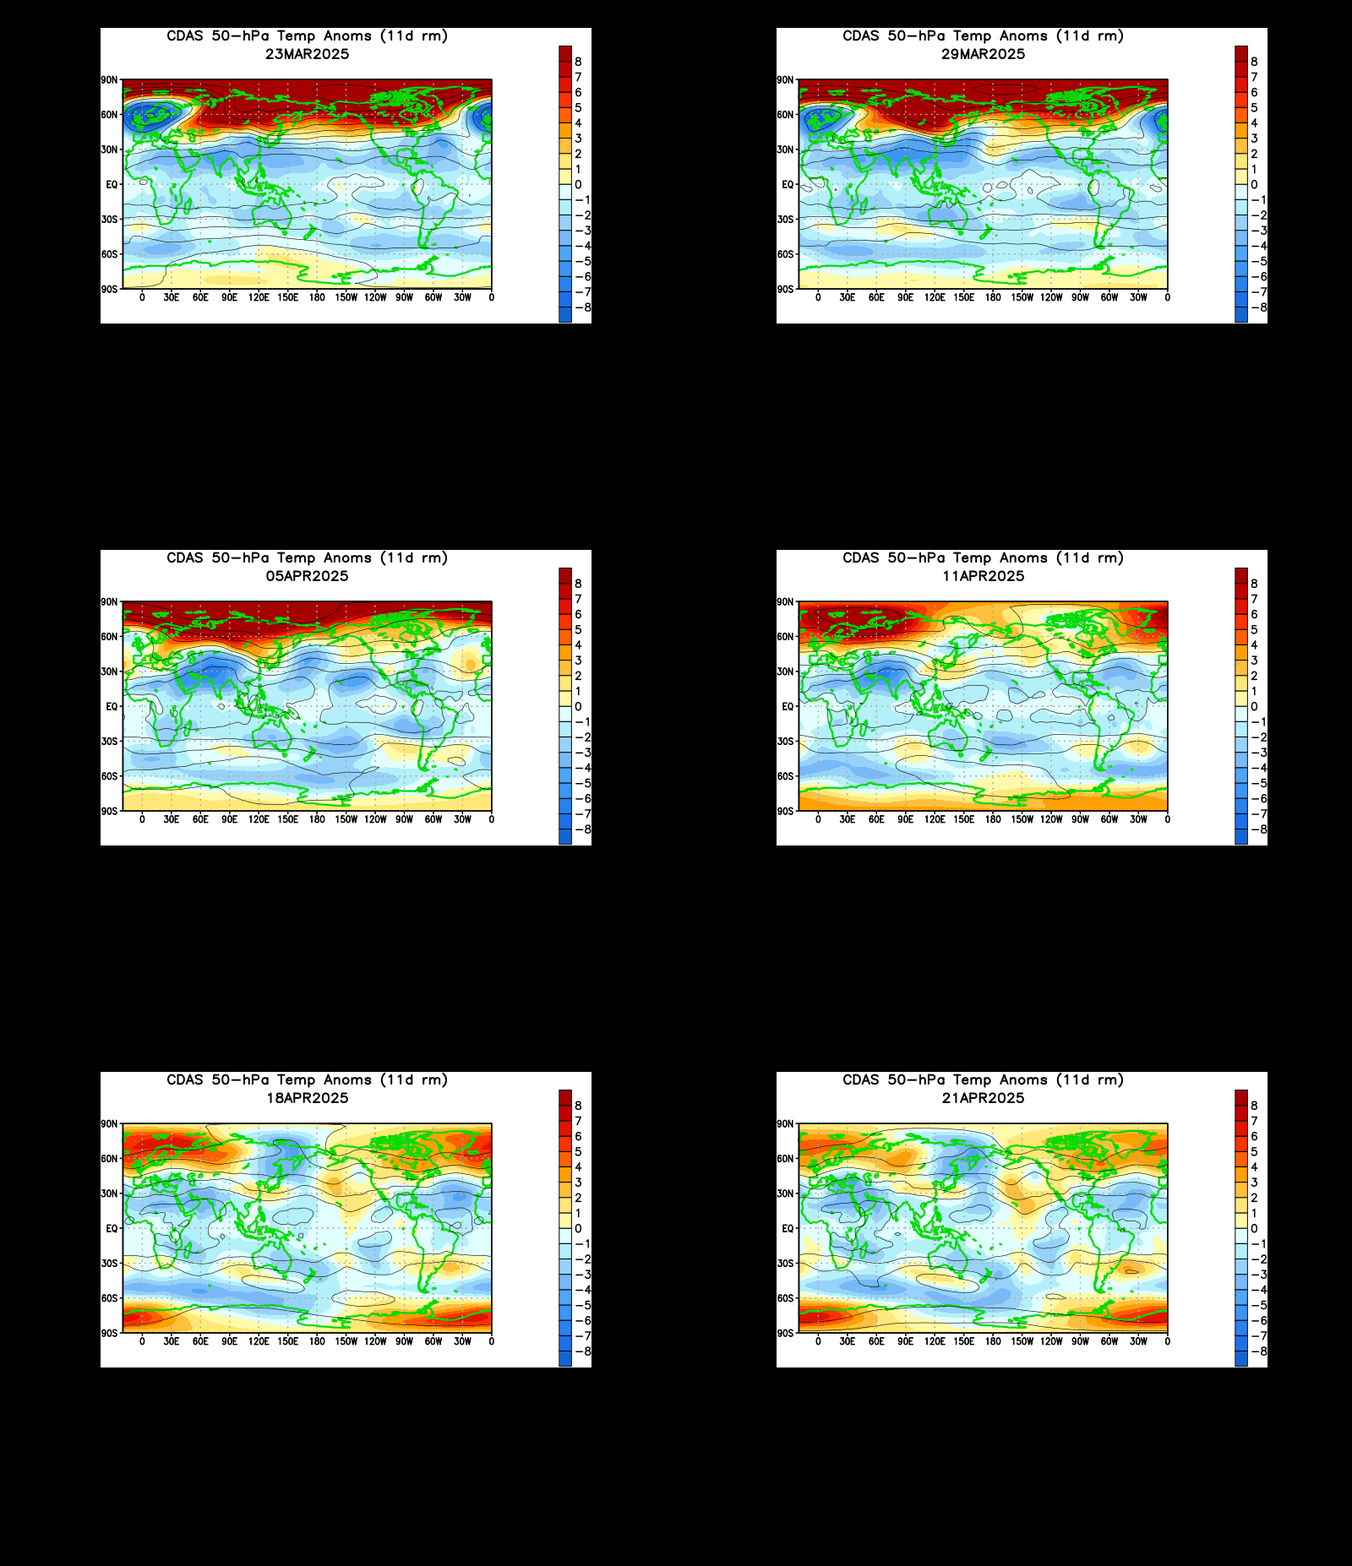
Lower levels of the stratosphere are also experiencing an incoming warming event with a finger of warmth beginning to propagate to the Arctic, as shown in the 30mb animation and 50mb animation below:

Also supporting my prediction of a polar vortex collapse and late January cold is the observed spread of anomalous warmth through the entire stratosphere as shown below:

This chart is printing out temperature anomalies for January-March of 2013, hence why it is barely colored in. But despite the small area of color, the trend of warm colors blossoming from the upper stratosphere and moving to the middle stratosphere is obvious and very clear to see. If this warming continues (which is expected, with another incoming mid stratospheric warming and incredible upper stratospheric SSW), the polar vortex will continue to suffer, and warmer colors will be shown on this chart above.

Andrew

Monday, January 7, 2013

Severe Arctic Cold Could Mimic January 1985


Forecasts continue to be on track for massive cold to enter the central and eastern US after making its presence known in the West US in the long range. Shown above are 500 millibar height anomalies for Hour 240 of the ECMWF model run from Weatherbell.

I want to go into the high pressure ridge building over the Gulf of Alaska. This is a negative East Pacific Oscillation, or EPO. When a negative EPO sets up, cold air is then provoked to move into the central and eastern parts of the nation. It is thought of as one corner of a triangle of teleconnections that can bring cold air to the US. The second piece is the Arctic Oscillation, or AO. When the polar vortex is weak, cold air is not able to be held by the vortex and slips south from the Arctic. This is a negative Arctic Oscillation. Considering the polar vortex is going through heavy damage, the AO will be strongly negative and could bomb out to extreme negative values. The third item is the North Atlantic Oscillation (NAO). In the negative NAO, the jet stream buckles south to give parts of the nation cold weather. We see a battle ongoing between low pressure just south of Greenland (typical of a positive NAO) and high pressure to the north of Greenland (typical of a negative NAO). I think the NAO is definitely the wild card here, and could determine whether the cold stays in the Plains and Midwest (what I am thinking) or moves East into the Northeast and East Coast (which will happen, but may not be as cold).


An issue we are seeing on both the ECMWF and GFS model (image on the left from WeatherBell) for this event is the negative Pacific North American index, or PNA. In the negative PNA, low pressure builds over the West US and Rockies and provokes high pressure to build in the East. This whole cold outbreak will start with a negative PNA, which is why warm air will be maximized on the East Coast prior to this warm up, as the top ECMWF image is showing.


So we're seeing a tricky NAO and a bad PNA. Is this cold really going to happen??

YES. Both models have the polar vortex (yes, THE polar vortex) sliding into southern Canada and the north US. As it does so, the low pressure causing the negative PNA will also move east, bringing the unforgiving Arctic cold into the Plains and Midwest. The dreaded Southeast Ridge will then move out of the East Coast, allowing for some moderated (but still harsh) cold to bleed into that region.

Why am I so confident? The GFS has been giving a stellar performance with the stratosphere thus far, meaning it has a better handle than that of the ECMWF. If the GFS is to be believed, a negative NAO, negative AO and negative EPO will be in place when the cold breaks off and moves east in about 10-15 days. However, I think the ECMWF has a better handle on the North Atlantic Oscillation, hence my thinking that the strongest cold will be confined to the Plains and Midwest-Great Lakes.

Beyond January 20th, things become very murky, and I don't even want to go into what could happen after this initial wave of cold. We will have to wait a few more days to get a clearer picture of what happens post-January 20.

How could it mimic January 1985?


The top image shows the geopotential height at 30 millibars in the stratosphere for January 21, 1985, while the bottom image shows the ECMWF forecast at 30 millibars for 10 days out. Note the eerie similarities between the two images. We have the polar vortex in nearly the same spots for Canada/US border (I circled the two vortices in blue for the top image), and nearly the same spot for the other vortice in Eurasia. This similarity, combined with the negative EPO and negative AO could very well make January 20-25, 2013 be an extremely cold time not unlike January 20-22, 1985.

Andrew

Stratospheric Analysis and Forecast: January 7, 2013

This is the Stratospheric Analysis and Forecast for January 7, 2013. This post will review observed conditions in the stratosphere first, then run over the forecasted conditions.

We start with the 10 millibar chart, showing observed temperatures from 2012 and 2013. If we look to the latest observed temperatures, we see a very sharp spike of temperatures in this layer of the stratosphere, indicating the sudden stratospheric warming event (SSW) has begun, thanks to an incredible swath of very above normal temperatures, as shown in the below animation, also from the 10mb layer:
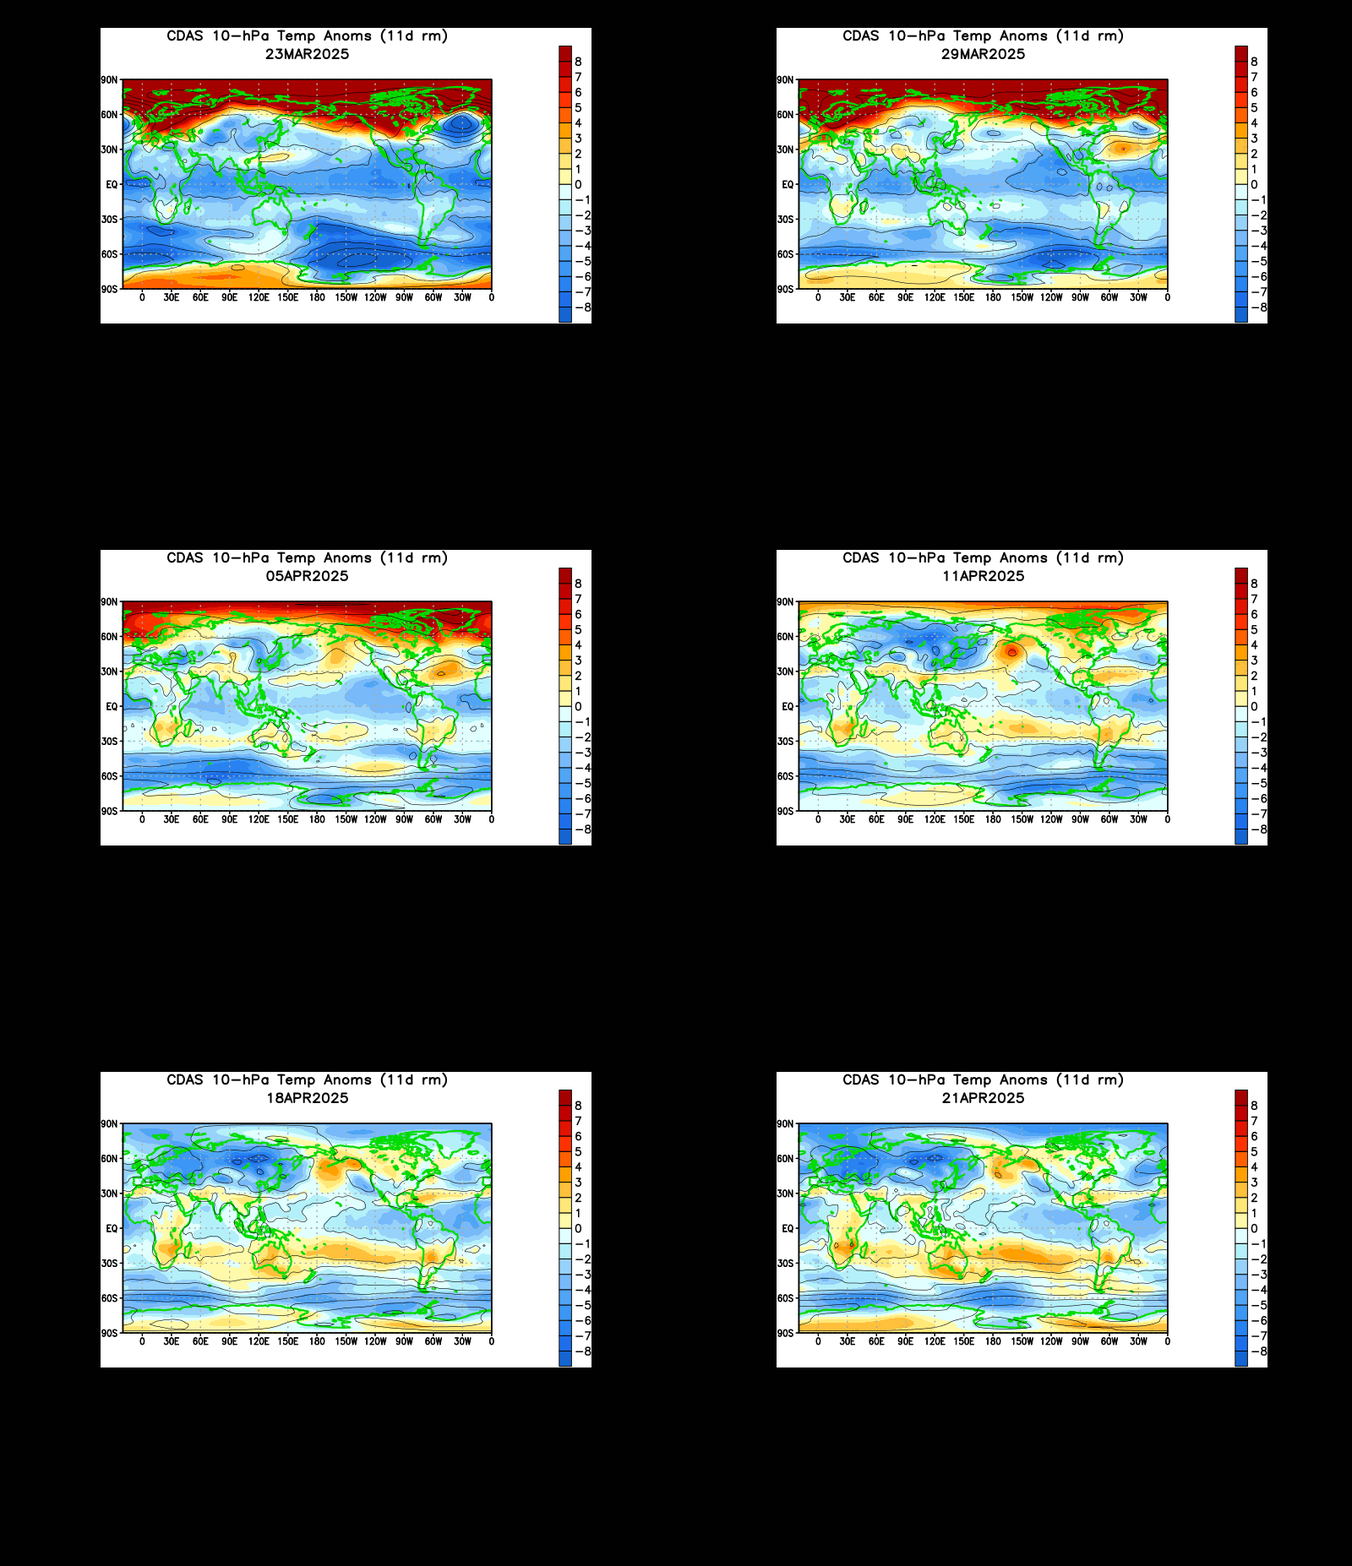
Notice how the warming event formed off of the Himalaya Mountains and has strengthened ever since. This is a classic example of how warm air can be pushed up mountains and create convection in the troposphere. In the stratosphere, the same event can happen, but with warming occurring in the stratosphere rather than convection. Watch the angle the swath of warming moves in the last several frames. You can see its upper-right hand portion begin to push northeast, towards the Bering Sea. This shows the willingness for the warming to propagate to the Arctic, and thus create a much more significant SSW. If this happens, the cold outbreak expected at the end of the month could be much worse than originally thought, but let's keep analyzing the ongoing conditions before we make any big assumptions like that.

The 50 millibar layer of the stratosphere, identified as the middle of the stratosphere, is also showing some modest warming in the latest observational charts, nowhere as significant as the 10 millibar layer. This comes as a previous sudden stratospheric warming event now tones down, and warmth in the Arctic at this particular level now exits the region as the SSW wraps up. This is all observed in the below animation from the 50 millibar image:

The animation shows the most recent SSW originating from Canada and penetrating the Arctic roughly around December 26th, the day after Christmas. The original SSW then created a finger of warm anomalies in far east Asia, which is beginning to tread east as the big sudden stratospheric warming event dies down. This will most likely be the base of the next sudden stratospheric warming, if there is one. It may not stay in far east Asia, but I have a good feeling this finger of warmth will be the instigator for the next SSW, should there be one.

Let's take a look now at past and present images of the 30 millibar layer:

30mb Temperatures and Heights on December 29, 2012
30mb Temperatures and Heights on January 4, 2013.
Comparing the top image, from December 29th, and the bottom image (from January 4) shows us that significant warming has indeed taken place across much of that layer of the stratosphere. The colder temperature colors have also been drastically reduced in response to this significant warming which, if it holds its ground or strengthens, would inflict increasingly heavier damage on the polar vortex. It would only take one good perfectly-placed SSW to knock the 30mb polar vortex out, possibly to collapse.
The more likely route to take would probably be a piece of the polar vortex splitting into multiple daughter vortices, with one going into Canada and the other staying in Europe. The warm temperature anomalies would then push poleward and instigate high pressure formation in between the two vortices to keep the vortices apart. The split is the first crucial step to a complete collapse of a polar vortex collapse. Will there be another SSW? I'll explain the potential later on.


These are potential vorticity (PV) values for the same dates mentioned above. They are listed in their isentropic levels, which is the 550K level. This equates to roughly 60 millibars or somewhere around there, so we're looking at the middle of the stratosphere. Higher PV values indicate the presence of low pressure, in this case the presence of the polar vortex. Comparing the two images, we see that the most recent image from January 4th on the bottom shows a deformed polar vortex compared to the top image. This clearly shows the split of the polar vortex in progress, with elongated PV values on the January 4th image. The blue PV values are areas of higher pressure, and these higher PV values are expected to press poleward and induce a split of the polar vortex into two vortices, again with one stationed over Canada and the other over Eurasia.

Now that we have a good prognosis on how the stratosphere is at the moment, let's see forecasted conditions for the stratosphere.


We are now entering the period of the second sudden stratospheric warming, in what appears to be the 10 millibar swath of warm air propagating to the Arctic. The top image shows zonal winds for the Day 2 forecast timeframe, while the second image displays temperatures and heights for the same timeframe but at the 10 millibar level. The zonal winds show the presence of the polar vortex and the effects of SSW's. In an SSW, winds in the stratosphere are slowed or reversed as the warm air shoots up the stratosphere. We can see this phenomenon happening with a large negative zonal wind anomaly setting up across much of the stratosphere from 70N - 90N. This corresponds well with warm air being found in the 10 millibar level, waging war against the polar vortices in Canada and Europe.

This is what I have been calling the Second Warming. When this SSW happens, we will see the split of the polar vortex, in what has been found as a three-step disintegration of the polar vortex: Displacement, Split and Collapse. We already had the displacement with the sudden stratospheric warming in late December, and this incoming warming event will lead to the Split. Now, I will show you increasing prospects for the Third Warming, what could become the final step in this three step process: the Collapse.

We start now with a zonal forecast of temperatures for the Day 10 timeframe, roughly when we start to see the Third Warming show itself. We see the typical warm temperatures in the troposphere below 300 millibars, the cold anomalies in the 200mb to 50mb range, and a warm temperature anomaly present in the 1mb-5mb range from the Equator (EQ) to 50N. But then comes another bulge of warm air from 70N to 90N. This was not present in earlier forecast timeframes from this model, meaning the Third Warming is appearing now on the ECMWF model. The presence of warm air in the upper stratosphere only continues to pressure the polar vortex to collapse.


The zonal wind forecast for Day 10 shows deep negative wind anomalies from 70N to 90N, with an emptiness of positive zonal winds in the lower stratosphere into the troposphere. This shows the reluctance of the polar vortex to expand as it has this Third Warming's negative zonal winds pressing in on it. Also of interest is the very deep negative zonal winds from the Equator to 20N. This phenomenon also restricts the polar vortex's expansion and assists in its weakening. And then there's a finger of negative wind anomalies from 30mb to 100mb on the left side of the image. This is another wind-based phenomenon known as the negative QBO. In the negative QBO, you will see naturally-occurring weakening of the polar vortex, not due to something extraordinary like a SSW, but because that is what the negative QBO does all day, every day when it is negative.

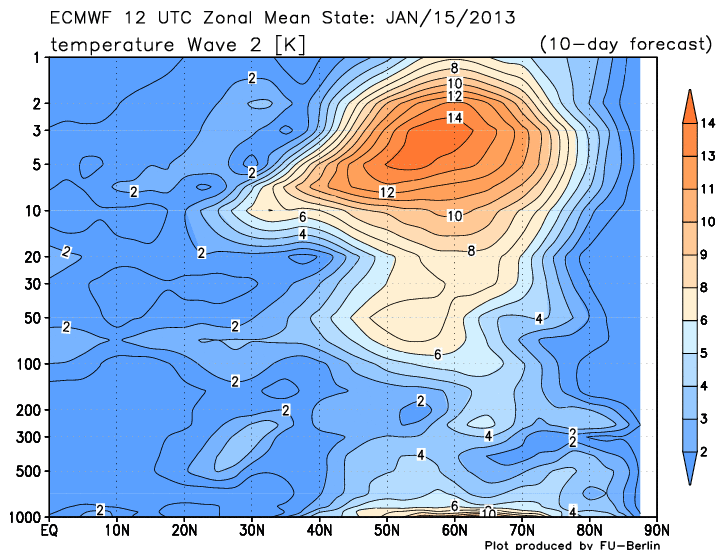
And now we take a look at Wave 2 of the temperature and geopotential height departments:


The charts may look complicated, but in reality they are very easy to decipher. For the top image, we see Wave 2 of the temperature forecast for Day 10. When there are higher temperatures in this image, one tends to see warming occur in the areas the warmest anomalies are over. For example, the warmest temperature anomalies are over the 2mb-20mb regions, meaning that is where you would expect to find the most stratospheric warming. As for the geopotential height Wave 2 forecast on the bottom, when you find warmer colors, it signifies higher pressure which is just that: high pressure. And high pressure working against low pressure (polar vortex) can result in weakening of the polar vortex. So the fact that high pressure is appearing in the Day 10 forecast is good news as far as weakening the polar vortex goes.

All those images were from the ECMWF model, and the above image here is from the GFS model. It is also showing the Third Warming, but at a slightly later timeframe (24 hours later than the ECMWF). The strongest warming appears to be forecasted over Canada and the Northern US. A quick glance at geopotential heights for the 10mb layer (same layer as the temperature image above) shows that this warming would strike right in the heart of the polar vortex at that level, possibly leading to a collapse of that particular vortice. From then on, it's anyones guess as to what happens.

Considering the North Atlantic Oscillation should be strongly negative during the timeframe of January 13 onward, and the Arctic Oscillation eventually going to trend strongly negative as well, it is inevitable that at least some of the nation will be greeted by some harsh cold weather. When the Madden Julian Oscillation (MJO) heads to Phase 8 in late January, we will have three indices working for harsh cold for the States. I see no reason to believe winter is over. A negative AO and negative NAO come together to incite much of the nation to be colder than normal. Considering this cold air will be pure Arctic air, if the cold air does flow south, you can bet it will be a very sharp cold outbreak, not a quick cold shot and then warmth again.

Andrew

Sunday, January 6, 2013

January 9 Severe Weather Event

The Storm Prediction Center is outlining a severe weather threat for January 9, 2013 in southeast Texas. This includes the cities of Houston and Corpus Christi. Let's see what will be causing this severe weather situation.

A storm system is currently digging into the Southwest as a positively-tilted system, meaning the highest vorticity values are tilted towards the southwest. As the storm moves along the US/Mexico border, it will turn from a positive tilt to a neutral tilt, and eventually a negative tilt as seen above. When you get that negative tilt, colder air flows in the upper levels of the atmosphere, leading to increased instability over the region within the warm sector.

The models are still uneasy on this system, but what is agreed on is the presence of either a negatively-tilted storm or a closed low. Either one can create significant precipitation and a severe weather situation. The ECMWF model is showing a closed low, whereas the GFS model above has the negative tilt within the system. This slight difference could be a huge game-changer for this severe weather set-up, whether it's a bust or an outbreak.

At the moment, I think this event will have a fair severe weather potential, but the lack of strong upper level winds and only moderate lower level winds, I expect this to be a more low-end severe weather event, not as big as it may seem. Model uncertainty only adds to my lack of confidence.

My forecast:
Red: Likely Severe Weather
Yellow: Possible Severe Weather

Andrew