Showing posts with label Bering Sea. Show all posts

Friday, September 18, 2015

Special Post: 2015-2016 Winter Pattern Beginning to Form?

In today's special post, we're looking at how the upcoming winter pattern may be giving a sneak peak at what it will do this cold season.

ESRL
The above two-panel image shows daily sea surface temperature anomalies for September 16th on the left, with the 500-millibar height anomalies for September 17th shown on the right. I've discussed the importance of realizing an ocean-atmosphere relationship for some time, and this latest evidence is only adding credibility to that relationship.

I've highlighted two areas of interest on the right-most panel. From Alaska, south into the British Columbia and Pacific Northwest regions, negative height anomalies were observed on September 17th. In the other highlighted region, positive height anomalies were extending from the Bering Sea into the waters north of Hawaii. Although not shown, we also saw a closed upper level low placed due south of that ridge in the Bering Sea, forming a Rex Block pattern.

It is no coincidence that sea surface temperature anomalies reflect this atmospheric pattern. We see a swath of above-normal to well-above-normal water temperatures across the North Pacific, with a body of below-normal SST anomalies just south of the Aleutian Islands, extending back towards Japan. In addition, we also see a cooling of water temperatures over the last month in the Gulf of Alaska / Northeast Pacific, as the graphic below shows.

BoM
Change in water temperatures over the last calendar month
In addition to this pattern showing up in the past, model guidance insists it is here to stay, at least for the next 10 days.

PSU
The GFS ensemble mean 500-millibar height anomaly forecast for 132 hours out is shown above on the left panel. We see a set-up very similar to what we have been seeing, with a Rex Block orientation in the North Pacific, a deep trough in the Gulf of Alaska, and a stagnant ridge in the Central and East US.

PSU
Even in the very long range, over 10 days out, the GFS ensembles still show a signal for ridging in the Bering Sea, a trough in the Pacific Northwest, and a ridge in the Central US. While accuracy at this long range timeframe is quite low, the pattern has a decent chance of locking up like this if it verifies 5 days down the road.

While we may see sea surface temperatures change drastically over the next few months, I'm getting the feeling that we're closing in on our winter pattern, and it could resemble something like the pattern shown above.
This current pattern, and the one forecasted over the next two weeks, is not unlike a modified strong El Nino, as shown in this link (click here), which I've been discussing as a favored set-up for the winter (a modified textbook El Nino pattern). Whether it sticks around and/or returns during the winter remains to be seen, but I find it plausible we enter into this pattern for the winter. This would bring about a warm winter for much of the Central and East US.

To Summarize:

- The current weather pattern is forecasted to continue over at least the next two weeks.
- This pattern is following sea surface temperature anomalies over the Pacific, making it more likely to maintain.
- This pattern resembles a modified Strong El Nino pattern, and could stick around for the winter months.

Andrew

Wednesday, November 12, 2014

November 25-29 Potentially Significant Winter Storm

We are beginning to nail down how this potentially significant winter storm may evolve across the country in the days surrounding Thanksgiving.
For my humor and your reading pleasure, I've divided this post into multiple sections, each concerning a different timeframe of this storm.

I. The Instigator 

Let's begin with a refresher on how this potential has come about.

OPC
On the morning of November 8th, we saw the remnants of Typhoon Nuri reach peak strength via Ocean Prediction Center observation. As the chart shows here, the massive storm bottomed out at 924 millibars. This means the storm, located at about 170E and 55N, didn't break the record for strongest extratropical cyclone on record, but it certainly came close.
Why do we care about this storm? The Bering Sea Rule states that a strong storm that hits the Bering Sea can produce a consequential storm in the United States about 17-21 days later. This is the same for high pressure in the Bering Sea. You probably get what I'm getting at here with this observed strong storm in the Bering Sea, so let's keep reading...

NWS
The graphic above, produced by the National Weather Service in Alaska, shows the observed mean sea level pressure of the storm at that 924mb reading, while the NWS office measured it at 930mb on the chart on the left, where strongest extratropical cyclones in the North Pacific are depicted. For multiple reasons, including the possibility that past storms may have been stronger than that 924mb reading, this storm was not declared the strongest on record in the North Pacific. Despite this, it's quite clear this storm was a historically-strong one, relative to storms in the last 60 or so years.

NOAA
Purely for comparison purposes, the team at KOPN Weather identified a strong storm in the Bering Sea on April 7th, 2011, bottoming out at 936mb, that was about 10 degrees W of where this very strong storm was observed yesterday in the Bering Sea. If you recall what happened about 2-3 weeks after the date of April 7th, we saw a certain tornado outbreak strike the South US, devastating thousands across the country, and causing millions on millions of dollars of damage. If we look at where the resultant storm ended up in mid-late April, utilizing the Bering Sea Rule, we find the storm situated in the Ohio Valley.

WPC
Now, keeping in mind that this sort of correlation is a tough one to use at best, not to mention all the caveats associated with long range forecasting, we could theoretically juxtapose the remnants of Typhoon Nuri and this storm in the Bering Sea on April 7th to get an idea of where the consequential storm in the US may end up. Recalling that the storm in 2011 in the Bering Sea was at about 180 degrees longitude, and almost the exact same latitude as the one observed in the last day or two, we find the remnants of Nuri placed about 10 degrees west of that 2011 storm. If we take the location of that storm system in late April (pictured above) and move it west, like the remnants of Nuri were west of that 2011 Bering Sea storm, we end up with a map like this:

WPC
Continuing this correlation, just to see what would happen, we notice that the remnants of Typhoon Nuri are moving eastward (a bit northeast in the process) in the Bering Sea right now, slowly at that. If this storm somehow does end up in that potential location outlined above, and if enough cold air is available (this will be discussed later), a significant winter weather event may strike the Central Plains, Midwest, Great Lakes, and Ohio Valley. Similarly, if the correlation works out, a severe weather event may strike the South US. Confidence remains low, but the potential for this correlation to verify is on the rise.

II. The Japan Connection

Now that we know where this potential is coming from, let's start to use it to our advantage, in the form of the Typhoon Rule (click here for explanation on the rule).

Tropical Tidbits
The image above shows the ECMWF model's forecast of 500mb geopotential height anomalies over the West Pacific. Here, cool colors denote stormy and cold weather, while warm colors depict mild and generally quiet weather. If we take a look at this forecast graphic, valid on November 17th, we find a rather strong trough/storm system pushing eastward into Japan. We can see this trough by the depression of height contours, and associated blue shadings. As this trough pushes through Japan, it looks to close off, a phrase used to describe when those contour lines literally close off and make a circle, indicating a closed low. Until then, we see this negatively-tilted trough hitting Japan around the 17th and 18th. Extrapolating that out using the Typhoon Rule, we find the potential for a storm hitting the US around November 23rd to 28th, oddly enough right around that timeframe that we saw with the intense Bering Sea low.

Tropical Tidbits
Moving on to the next graphic, we find the GFS-Parallel model forecast for November 17th, again forecasting 500mb height anomalies. The GFS-Parallel is not the same as the regular GFS; this Parallel model is the new, enhanced version of the current GFS model, which is set to be 'retired' in the next few months, where the new GFS will take its place. Among new corrections are bias fixes and increased accuracy, etc. The difference from the ECMWF model to this GFS-Parallel forecast is the Parallel model closes off this trough a bit quicker than the ECMWF, as that circular contour line over Japan shows. At this point, it's not so much a question of if this storm will strike Asia, so much as it is what strength will it be and when will it close off. Regardless, the ECMWF and GFS-Parallel both support this storm threat.

Tropical Tidbits
To add in a bit of diversity, let's check out the ECMWF ensemble mean 500mb height anomaly forecast for November 18th. In this image, we see the average of all 52 - yes, as in fifty two separate ensemble members - forecasts favoring a non-closed trough over Japan. This is a bit surprising, as the guidance we went over above has this trough closing off over Japan or just after it leaves the "mainland" of the island nation. Despite this disagreement, which will no doubt be worked through as the time between now and November 17th/18th approaches, the ensembles agree with the other two models on this being a substantial storm crossing Japan, with a consequential storm in the US around November 23-28.

III. The Set-Up

We're now in the timeframe where we can get a view of model projected set-ups for the storm environment (with typical low-confidence, of course). Let's go through the projected set-ups.

Tropical Tidbits
The image above may seem confusing, but it's not that difficult to interpret once you get a feel for it. This image shows the GFS ensemble forecasted 500mb height anomalies, averaged out across the ~20 ensemble members, valid on November 26th. Let's first begin with the positive height anomalies in the West US into British Columbia. We see what are interpreted to be slightly above normal height anomalies, but if this forecast verifies, you'll see these anomalies increase to more extreme values as confidence among all ensemble members increases. For now, confidence is low, so the anomalies aren't as pronounced.
Those positive height anomalies in the West are enabling a positive Pacific-North American (+PNA) pattern to set up. In a positive PNA pattern, ridging in the West forces the jet stream south. If resultant ridging forms in the East, the jet stream then bends north, to enable frigidly cold air to strike the Central/East US, also driving the storm track through that area. This pattern across North America is a classic +PNA pattern, and should be treated as though the Great Lakes/Plains may see the brunt of this storm... initially.
My concern rests with that big upper level low stationed just west of Greenland. If that low becomes too strong and pushes too far south (which is a plausible result), the storm track may be suppressed, and the big winners could end up being the Ohio Valley and interior Northeast. This is something to watch closely in coming days. For now, due to how the Pacific appears to be controlling the pattern, I would favor a Midwest/Great Lakes impact, but let's keep analyzing.

Tropical Tidbits
This graphic is the same type of forecast chart as the one we just discussed, but now comes from the Canadian ensembles, and is valid for November 25th. Despite this slight time difference, note that trough in the Central US, which could be our storm (though the timeframe's a bit fast for my liking). Once again, we see a positive PNA pattern, somewhat suppressed by lackluster ridging in the West US, but compensated by intensified ridging along the East. This would bend the storm track in favor of the Midwest and Ohio Valley for any big snows, and the Gulf Coast could then see some severe weather. Again, this will all sort itself out in due time, and this is merely something to watch for now.

IV. The Storm

It's all been leading up to this, folks. While I don't trust individual model guidance to show what the storm will be like (since it changes from forecast to forecast; no consistency), I would like to show the GFS ensembles' thoughts.

WeatherOnline
What you see above is a 'cluster' forecast from the GFS ensembles, valid on November 26th (technically the evening of the 25th in our time zones), forecasting precipitation and sea level pressure values over North America. I'll show the description of 'cluster' modelling below from the Weather Prediction Center, then I'll try to interpret it for others who may not understand at first.

Sometimes the ensemble members tend to group themselves into two or more solutions.  For example in the image above the ensembles cluster in two solutions off the Pacific NW coast  of the U.S. (a trough south of the Aleutian Islands and a trough off the Pacific Northwest coast of the U.S.).
CLUSTERING is an automated method that identifies and extracts like members and derives output from these like solutions (of which there are different methods to identify clusters).
If you didn't understand that, let's go through an example. Recall that the GFS ensembles have around 20 members, each of which produces its own, different forecast. Let's say that on November 26th, a certain number of ensembles are showing a relatively similar forecast. The 'cluster' method combines these similar forecasts, and does the same with other, like forecasts into 'clusters' of ensemble members. This allows us to narrow down how many ensembles are showing what type of solution for a certain time frame.

Going back to the GFS ensemble image above, approximately 30% of ensemble members' forecasts for this timeframe show a solution like the one above. This solution means a very strong storm would push north and east across the Midwest, like that positive PNA pattern may induce. The result? Heavy snow likely in parts of the Midwest and Great Lakes, while the South may see severe weather.
At first, you may think 30% is not that high. And you'd be right. But for a forecast 324 hours out, about a third of the ensembles showing this sort of solution isn't a bad thing to see if you're hoping for snow in the Central US.

Here's a good representation of what a scenario like the one above may result in.
I'm going on record and saying this is not a forecast! Please don't treat it as such!

Representation of one possible track for this storm.
Again, this is not a forecast, and it shouldn't be treated as such.
To summarize:

- Model guidance continues to support the idea of a strong storm system in the United States around Thanksgiving.
- The set-up for this storm looks to favor a storm track over the Central/East US.
- One model's representation might show heavy snow for the Midwest and Great Lakes.
- Low confidence, high caveats remain present.

Andrew

Sunday, November 9, 2014

November 25-29 Potentially Significant Winter Storm

The storm system around the November 25-29/Thanksgiving timeframe continues to look like a significant storm system.

OPC
On the morning of November 8th, we saw the remnants of Typhoon Nuri reach peak strength via Ocean Prediction Center observation. As the chart shows here, the massive storm bottomed out at 924 millibars. This means the storm, located at about 170E and 55N, didn't break the record for strongest extratropical cyclone on record, but it certainly came close.

NWS
The graphic above, produced by the National Weather Service in Alaska, shows the observed mean sea level pressure of the storm at that 924mb reading, while the NWS office measured it at 930mb on the chart on the left, where strongest extratropical cyclones in the North Pacific are depicted. For multiple reasons, including the possibility that past storms may have been stronger than that 924mb reading, this storm was not declared the strongest on record in the North Pacific. Despite this, it's quite clear this storm was a historically-strong one, relative to storms in the last 60 or so years.

NOAA
Purely for comparison purposes, the team at KOPN Weather identified a strong storm in the Bering Sea on April 7th, 2011, bottoming out at 936mb, that was about 10 degrees W of where this very strong storm was observed yesterday in the Bering Sea. If you recall what happened about 2-3 weeks after the date of April 7th, we saw a certain tornado outbreak strike the South US, devastating thousands across the country, and causing millions on millions of dollars of damage. If we look at where the resultant storm ended up in mid-late April, utilizing the Bering Sea Rule, we find the storm situated in the Ohio Valley.

WPC
Now, keeping in mind that this sort of correlation is a tough one to use at best, not to mention all the caveats associated with long range forecasting, we could theoretically juxtapose the remnants of Typhoon Nuri and this storm in the Bering Sea on April 7th to get an idea of where the consequential storm in the US may end up. Recalling that the storm in 2011 in the Bering Sea was at about 180 degrees longitude, and almost the exact same latitude as the one observed in the last day or two, we find the remnants of Nuri placed about 10 degrees west of that 2011 storm. If we take the location of that storm system in late April (pictured above) and move it west, like the remnants of Nuri were west of that 2011 Bering Sea storm, we end up with a map like this:

WPC
Continuing this correlation, just to see what would happen, we notice that the remnants of Typhoon Nuri are moving eastward (a bit northeast in the process) in the Bering Sea right now, slowly at that. If this storm somehow does end up in that potential location outlined above, and if enough cold air is available (this will be discussed later), a significant winter weather event may strike the Central Plains, Midwest, Great Lakes, and Ohio Valley. Similarly, if the correlation works out, a severe weather event may strike the South US. Again, many caveats are associated with this method, and this should not be taken as "gospel", or at face value.

Tropical Tidbits
The above image shows temperature anomalies at the 850 millibar level (about 5,000 feet off the ground) over North America, as forecasted by the ECMWF ensembles ten days from today. In this image, we see a large swath of warmer than normal temperatures in the Bering Sea, with colder than normal conditions encompassing much of the United States and southern Canada. This looks to be a persistent pattern in coming days and weeks, as a large block of high pressure looks to set up shop directly over the Arctic, providing for a very cold period for North America. Extrapolating this to Thanksgiving, enough cold air should be in place for at least a modest threat of a significant snow event. Again, bear in mind long range caveats, but such a prognosis is favored right now.

To summarize:

- A potentially significant storm system still looks to evolve in the United States around Thanksgiving.
- Severe weather will be a possibility, namely in the South US.
- Significant snow will be a possibility, predominantly in the Central Plains, Midwest, Ohio Valley, and Great Lakes (for now).
- Thanksgiving travel may be severely hampered by this storm, if it does come to fruition as currently projected.

Andrew

Tuesday, November 4, 2014

Thanksgiving Potentially Significant Early-Season Snowstorm

This is the latest discussion about the possibility of a Thanksgiving early-season snowstorm. This discussion will provide a comprehensive overview of model guidance, in addition to the expected cold air influences and potential location of the storm.

Tropical Tidbits
The image above shows the ECMWF 500mb geopotential height values in color, with superimposed mean sea level pressure (MSLP) values and appropriated high/low pressure marks. In this image, valid for November 8th over the West and North Pacific basins, we see an incredibly strong extratropical storm circulating over the far western Aleutian Islands, with a minimum SLP value of 923 millibars.

This has been the theme over the past few days, as the remnants of Typhoon Nuri are expected to race northeast into the Bering Sea, and undergo 'bombogenesis', or incredibly rapid strengthening (weather folk call it "bombing out" to mean a storm quickly becomes stronger), to develop into this projected 923 millibar beast. The ECMWF model has this storm located the furthest west out of all the guidance we will go over tonight. Make sure to keep an eye on placement of the low in all of these forecasts, as it will make a significant difference on where this resultant storm may end up.

Tropical Tidbits
We'll move now to the GFS model projection, again of 500mb geopotential height values, and superimposed MSLP forecasts. These two parameters will show up on the remainder of model guidance, to keep things as simplistic as possible. In the GFS forecast, valid for the same November 8th timeframe, we find the storm placed substantially east of the ECMWF outlook, and with a minimum SLP value of 924 millibars.

A brief background on why we're focusing on the Bering Sea so much here: The potential for a significant winter storm evolves out of the Bering Sea for this forecast. The method, referred to as the Bering Sea Rule, takes the occurrence of high and low pressure events in the Bering Sea, and expects a similar weather phenomenon to occur in the US about 17-21 days later. This is almost exactly like the Typhoon Rule I commonly discuss when analyzing winter storm potentials, except now the area to watch is the Bering Sea, and the timeframe from occurrence in the Bering Sea to reciprocation in the US is now 17-21 days. Therefore, if we take the storm in the image above (valid on 11/8) and extrapolate it out using the BSR guidelines, we come up with a potentially significant storm in the November 25-29 period, give or take a day or two. 

We can see the theme of a low 920s millibar storm hitting the Bering Sea, so let's keep pushing ahead.

Tropical Tidbits
Next up, we'll examine the GFS-Parallel forecast. This is the model expected to succeed the current GFS model, with higher resolution and corrected model biases. This model shows the Bering Sea storm bottoming out at 919 millibars, the strongest forecast of the three observed thus far. This storm appears to be a combination of the ECMWF and GFS models; you can click on one and move back and forth between images to get a sense for such a shift.

We've evaluated three major models thus far, all of which combine for a mere five millibar spread (minimum 919mb to maximum 924mb). We can now see confidence greatly rising in this potential for a very strong storm to hit the Bering Sea; let's see if ensemble guidance agrees.

Tropical Tidbits
Moving ahead to the ensembles, first and foremost the ECMWF Ensembles, we find the average of all 52 members - yes, that's fifty-two individual ensemble members - to place this storm at a strength of 938 millibars. With the storm only 96 hours away from entering the Bering Sea, and ensemble guidance continuing to strengthen with time, confidence only rises in this possibility of a near-record-breaking extratropical cyclone to strike the Bering Sea. 

As a side note, notice how the ECMWF ensembles are slightly east of the ECMWF model itself. We'll discuss this more later on.

Tropical Tidbits
Finally, we'll take a look at the Canadian GEM ensembles. The GEM model itself was unavailable for use in this post, so we'll use the ensembles as the next-best-thing, if not the best thing. The GEM ensembles show the average of all ensembles (around 22 individual members, if I recall correctly) to be slightly east of the ECMWF ensembles, with a mean strength of 948 millibars to be the weakest with this storm out of all global guidance. 

So, now that we've evaluated all model guidance available at the time of posting, let's summarize a few things to take away.
- Major operational model guidance is down to a consensus that the storm will likely land somewhere around 920 millibars in strength. That's a VERY strong storm.
- Ensemble guidance is still in disagreement, but does find a conclusion that there will be a strong storm in the Bering Sea for this timeframe.

I said I would discuss why location is key in the models, so let's quickly discuss. From the team at KOPN, it appears that weather in the Shemya Island region of the Aleutian Islands correlates roughly to weather in north-Central Missouri. Thus, one could believe that a storm northwest of Shemya would see a storm in the Plains, a storm south of Shemya might see a Texas storm system, etc. 

Google
The pinpoint above shows the location of Shemya, Alaska. Doing a quick visual comparison to the five model guidance graphics we went over earlier in this post, but also remembering this location correlation is NOT proven quite yet (as of now, it's interpreted to act as a guideline), this Bering Sea storm would likely correlate to a powerful storm in the Upper Midwest, Plains, Midwest, Great Lakes, Canada... this particular correlation method is not an exact science, and should not be interpreted as such. Hence why it's only a guideline for now

But we're not just watching for a powerful winter storm- we're watching for potentially significant cold!

CPC
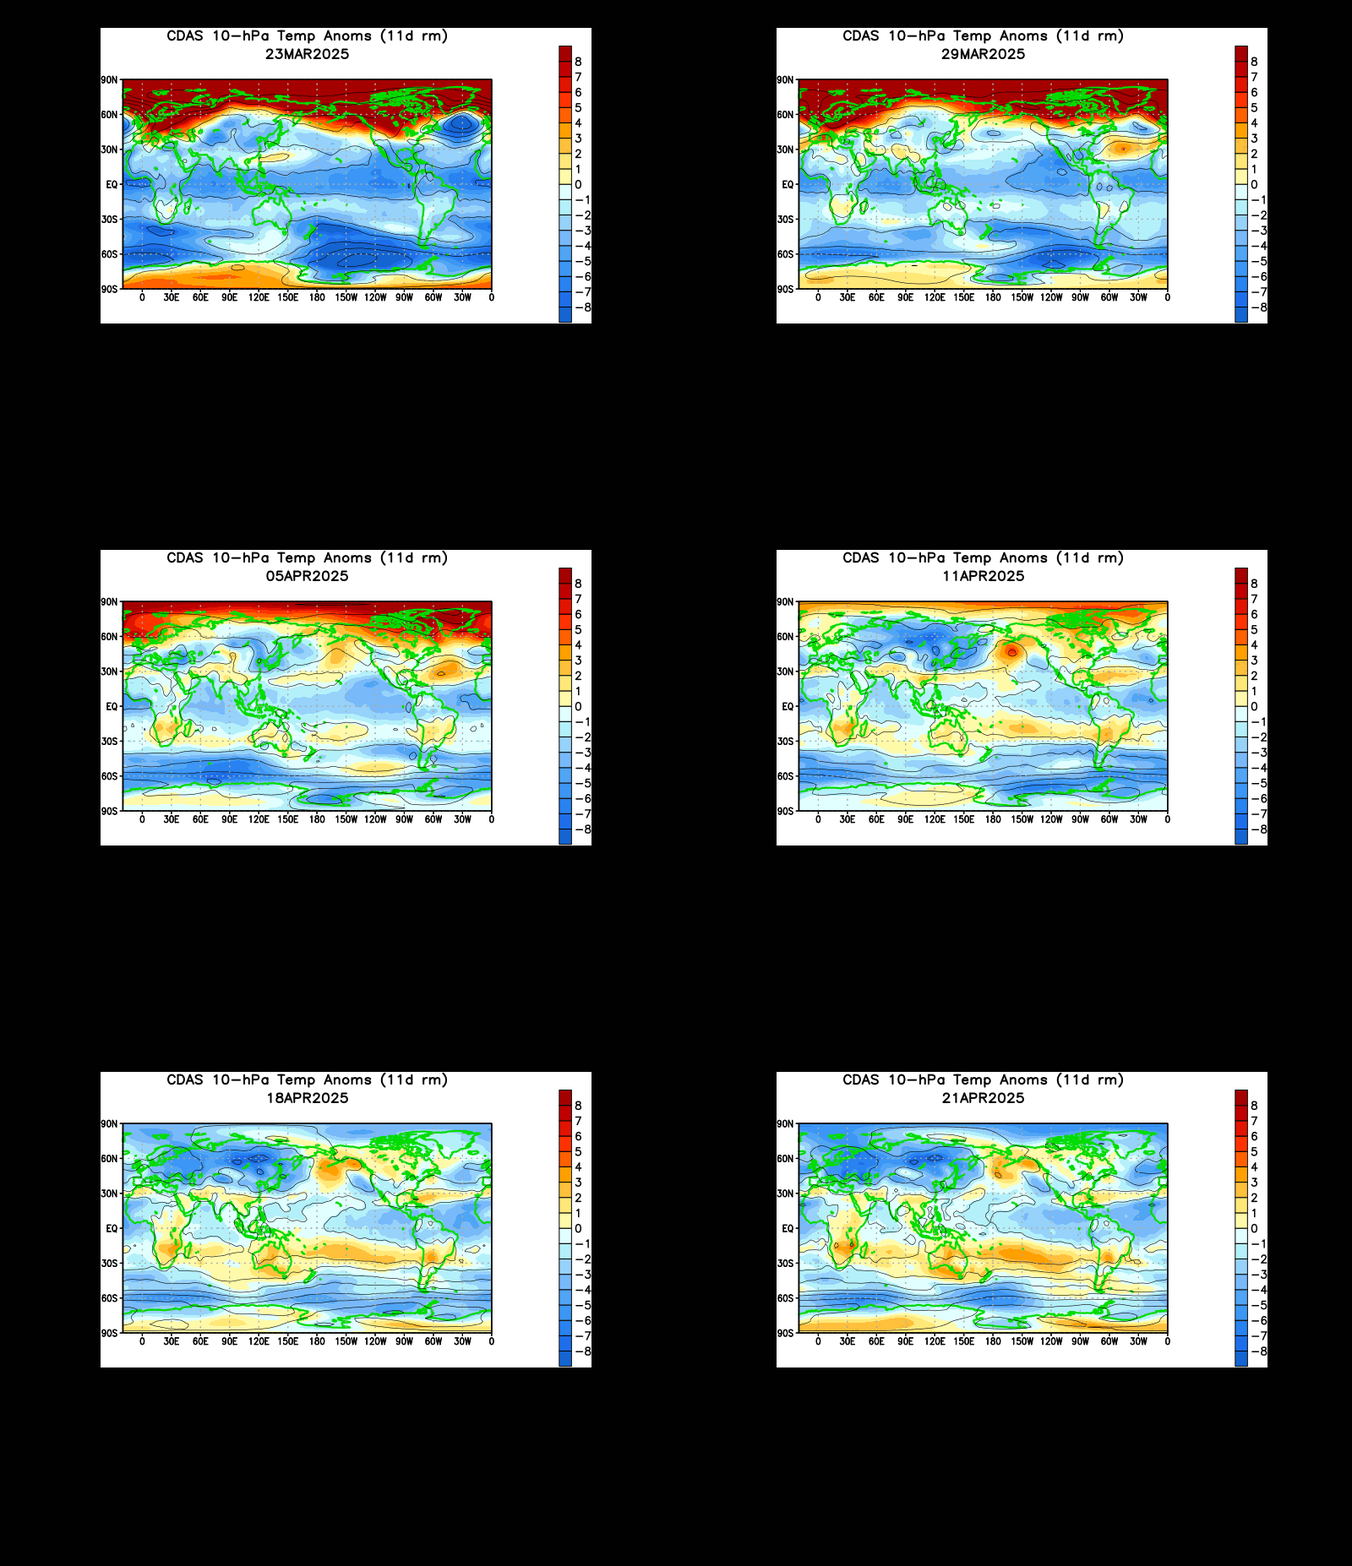
The animation above shows temperature anomalies at the 10 millibar level, in the far upper reaches of the stratosphere, over the past month or so. According to this animation, we recently saw a very early stratospheric warming event overtake the Eurasia and North Pacific basin. If we remember that the warmth in the stratosphere typically results in very cold weather at the surface about 2-4 weeks later... put the pieces together, and we could very well see a strong body of cold air intercept this potentially significant winter storm system, making for one heck of a situation that could unfold.

Let's summarize all of this.

- Confidence is growing in the threat of a near-record-breaking extratropical storm system impacting the Bering Sea.
- If this forecast goes as planned, a powerful storm system would be expected to traverse North America around or just after Thanksgiving.
- Abundant cold air provided by the stratospheric warming may enable a larger threat of snow, if such a threat does evolve.
- A high amount of uncertainty still exists with this storm potential, hence the continued caveat-laced language in these posts.

Andrew 

Monday, November 3, 2014

Thanksgiving Potentially Significant Winter Storm

This is an update to yesterday's post, discussing a potentially significant winter storm in the November 24-30 timeframe.

Tropical Tidbits
The image above shows the ECMWF 500mb geopotential height values in color, with superimposed mean sea level pressure (MSLP) values and appropriated high/low pressure marks. In this image, valid for November 8th over the West and North Pacific basins, we see an incredibly strong extratropical storm circulating over the far western Aleutian Islands, with a minimum SLP value of 920 millibars.

To give you an idea of how strong this reading is, if this forecast from the most prestigious weather model in the world were to verify, we could very well break the record for the lowest extratropical minimum SLP value ever recorded (the lowest SLP value ever belongs to Typhoon Tip, with 870 millibars, but that was a tropical system). But the most intriguing thing?

It could actually happen.

This whole process looks to begin with the remnants of Typhoon Nuri, currently offshore Japan, which will race northeast and quickly strengthen as it approaches the Bering Sea. While storm systems tend to strengthen in the Bering Sea, this one may strengthen much faster and even stronger than most due to that tropical component from Typhoon Nuri.

But wait! Why should we care about this? What about the Thanksgiving storm? The potential for a significant winter storm evolves out of the Bering Sea for this forecast. The method, referred to as the Bering Sea Rule, takes the occurrence of high and low pressure events in the Bering Sea, and expects a similar weather phenomenon to occur in the US about 17-21 days later. This is almost exactly like the Typhoon Rule I commonly discuss when analyzing winter storm potentials, except now the area to watch is the Bering Sea, and the timeframe from occurrence in the Bering Sea to reciprocation in the US is now 17-21 days. Therefore, if we take the storm in the image above (valid on 11/8) and extrapolate it out using the BSR guidelines, we come up with a potentially significant storm in the November 25-29 period, give or take a day or two.

Tropical Tidbits
This next graphic above shows the same 500mb height values and superimposed MSLP values over the West Pacific, like the ECMWF model forecast, but now from a different model. This is the GFS-Parallel model, rumored to be the next-generation forecasting model that will soon replace the GFS model. For the time being, this is an experimental model, and won't become operational for another month or two, but it's still worth using for examination purposes.

Here, we see in this forecast for November 8th, the minimum SLP is down to 914 millibars. That's about 6 millibars stronger than the ECMWF forecast, and indicative of a likely-record-breaking storm, but the premise remains the same. Both model guidance systems are showing a very strong storm system in the Bering Sea in this November 8th timeframe. If you're a true analyst, you might notice that the GFS-parallel forecast is just a bit east of the ECMWF forecast. That does make a difference in this forecast, and I'll explain it a bit later in this post.

Tropical Tidbits
In the spirit of including the old with the new, we'll go over the currently-operational GFS model and its forecast. Here, we see the projection for November 8th calls for a 923 millibar cyclone to hit the Bering Sea. This is the weakest of the three forecasts we've analyzed thus far, but that's a pretty odd thing to say when the weakest member of the three is "only" at 923 millibars. Despite the slightly weaker outlook, the consensus is still for a very strong, possibly record-breaking storm to hit the western Bering Sea.

Tropical Tidbits
Lastly, to show I'm willing to include all angles and not, as some may accuse, only the strongest projections, we'll go over the ECMWF ensemble set. The ECMWF ensembles, commonly called the most accurate ensemble set in the world at this time, are forecasting a minimum SLP of 947 millibars for this storm system on November 8th.

If you aren't sure how to interpret this, I'll sum it up: WOW!

Ensemble guidance is composed of a number of 'members', or versions of the original model that have been slightly altered, intentionally, to produce a 'spread', or variation, in the forecast. This then adds accuracy to the forecast. It's very surprising to see a set of ensembles - from the ECMWF, no less - to be calling for a 945mb storm to strike the Bering Sea. This average of 52 - yes, fifty-two separate ensemble members - indicates that certainty for such a strong storm to hit the north Pacific is on the rise. It's quite plausible we see this minimum SLP from the ECMWF ensembles drop in future runs.

But we're not just watching for a powerful winter storm- we're watching for potentially significant cold!

CPC
The animation above shows temperature anomalies at the 10 millibar level, in the far upper reaches of the stratosphere, over the past month or so. According to this animation, we recently saw a very early stratospheric warming event overtake the Eurasia and North Pacific basin. If we remember that the warmth in the stratosphere typically results in very cold weather at the surface about 2-4 weeks later... put the pieces together, and we could very well see a strong body of cold air intercept this potentially significant winter storm system, making for one heck of a situation that could unfold.

You might have noticed a combination of rather ominous language about the storm, as well as more than a few caveats. Both are well warranted, as we'll have to wait and see if this storm ends up being as strong as projected in the Bering Sea.

To summarize:

- The potential exists for a significant winter storm around Thanksgiving.
- With stratospheric-induced cold air possibly intercepting this storm, winter weather may be a serious issue to contend with.
- High uncertainty still exists, but appears to slowly be waning.
- As of now, the Central and East US look to be affected by this storm (i.e. Midwest, Great Lakes, Ohio Valley, Northeast...).

Andrew

Wednesday, September 10, 2014

Multiple Arctic Blasts Projected to Hit North America During Coming Weeks

The remainder of September into October looks to feature a series of Arctic cold shots, potentially record-breaking at times.

Tropical Tidbits
Click to enlarge
The first cold threat looks to arrive only in a matter of days after our ongoing cold shock. Shown above is the GFS ensemble forecast over the Western Pacific, showing expected 500mb geopotential height anomalies. Reds indicate above normal height anomalies, consequentially warmer and quiet weather. Blues depict negative height anomalies, which often result in cold and stormy weather. 

In the image above, valid September 11th, we see a swath of negative height anomalies overtaking Japan as a rather strong upper level low scrapes the nation to the north. Seems pretty mundane, sure, but the consequences here at home are far more than mundane. As has been discussed consistently for the past couple of years, the weather in East Asia can have a significant impact on weather here in the United States. Utilizing the East Asian correlation of ridging over Japan equals ridging in the US 6-10 days later, and the same situation with negative height anomalies, we can foresee long range weather patterns weeks out at a time. This mechanism is referred to as the Typhoon Rule, and states that weather patterns found at the 500mb level can replicate themselves over North America 6-10 days later after they appear over Japan. 

 If we use this rule on the model image above, a rather strong upper level low with the accompanying threat of some cold Arctic air may begin affecting the US around September 17-21st, within the six-to-ten day timeframe discussed above.

Tropical Tidbits
The image above once again shows forecasted 500mb height anomalies over the West Pacific, now valid on September 18th. Again, we see another swath of negative height anomalies over Japan, apparently due to another strong upper level low pressing south into the northern part of the country.

Using the aforementioned Typhoon Rule, it appears our second cold blast may impact the country around a September 24-28th timeframe. This one may be more significant than the last, as ensembles are already highlighting well below normal height anomalies this far out, and the upper level low appears deeper and more pronounced than the one in our first Arctic air threat.

Plymouth State
Our third threat at Arctic air follows closely behind our second threat. The image above, from Plymouth State University, shows the ECMWF model's forecast of 500mb heights (shaded colors and white contour values) and mean sea level pressure (MSLP) values (black lines). In this image, valid September 13th, we see a strong upper level low placed over the eastern Bering Sea. Just as we saw in Japan, this appears rather mundane, but actually plays a significant role in our upcoming weather.

By observing trends in the Bering Sea, weather conditions in the US can be predicted 17 to 21 days in advance. For instance, if the Bering Sea experiences a deep storm system, cold weather may be expected 2.5 to 3 weeks later. The same goes for high pressure in the Bering Sea. In this case, with the forecast above valid on September 13th, we may expect a rather significant cold blast over the United States for the end of September and into October, in a general September 30th - October 4th time period.

Plymouth State
It's this last Arctic air threat that has me concerned. The image above once again shows the ECMWF's outlook of 500mb heights and MSLP values, now valid on September 17th. In this image, we see decidedly below-normal heights spread across nearly the entire Bering Sea, with the core of this messy trough centered just north of the Aleutian Islands.

This scenario worries me a bit. Even though this is definitely a long range forecast (and thus shouldn't be seen as high-certainty), the premise is concerning. The ECMWF's proposition of a cold air mass across the entire Bering Sea would suggest more of a long-term cold weather period, across a big chunk of the nation. Extrapolating the forecast time period of September 17th, we might expect some cold weather around an October 4th - October 8th period, possibly for longer.

A short-term warm-up can be expected in the last week or two of September before the cold continues.

Stay tuned for continuing updates on these threats.

Andrew

Tuesday, May 13, 2014

Summerlike Warmth Returns for First Days of June

I'm expecting summerlike warmth to come back for the first week or so of June.


The image above shows projected 500mb height anomalies over the northern hemisphere. We can signify the blues with negative height anomalies, which indicate the presence of cooler and stormier weather, while reds denote positive height anomalies, which allow for warmer than normal and calm weather. In the image above, if we look towards the Bering Sea, we can see a very strong ridge of high pressure, seen by the splotch of red around the Aleutian Islands. This image is valid for May 13-14, and if we extrapolate it out 2-3 weeks using the Bering Sea Rule, we can expect high pressure and warm weather to appear in the East US.


If we look at another 500mb height anomaly forecast graphic, this one valid on May 19th, we now see that our strong ridge has shifted west into the middle of the Bering Sea, with cooler, stormier weather now protruding into western Alaska. This tells us that we can expect warm temperatures in the first several days of June in the middle of the country, with cooler conditions along the Eastern Seaboard.

This warmth is supported by long range modelling of enhanced tropical convection around the central Pacific, which is typically associated with warmer than normal weather in the Central and East US in the May-June-July time period. The bottom panel in the graphic above demonstrates the enhanced convection (blue) present in the Central Pacific.

Andrew

Thursday, January 30, 2014

February 4-6 Potentially Significant Winter Storm - Updated January 30

There remains a good chance of a significant winter storm in the February 4-6 timeframe. There is also a good chance of the storm track shifting north, so let's dive right in.

(The following is copied from the January 28 post on this storm)


Shown above is the 500mb anomaly forecast off the ECMWF model, valid on the morning of January 26th. If you've followed this blog for a while, you know that we can use that area of negative height anomalies over Japan to forecast a storm in the United States. As Joe Renken states, we can extrapolate a storm over East Asia out 6-10 days to arrive at the timeframe for a storm here in the United States. Going that length past January 26th gives us a storm timeframe of February 1-5. That's not the only thing we can take away from this predictor, however. Looping the ECMWF forecast tells me that the storm system will be moving essentially due east as it passes through central Japan. This tells me that we could (keyword here is could) see our February 1-5 storm system also moving on a west-to-east track, not really curving north or dropping south too much. The 12z and 18z GFS models caught on to that idea of a west-to-east storm, but had the storm hitting the US on January 31st to February 1st, which is just outside the timeframe presented here. We'll discuss the models a bit later on in this post.
Adding to the evidence of a possible storm in the early February timeframe is what we saw happen in the Bering Sea on January 18th. The image above shows contoured 500mb height anomalies over the north Pacific on January 18th. We see a storm system moving east from far northeast Russia, which is the westernmost 'X' on the image above. The next day, we saw the storm move nearly due east to the second 'X' in the image, only moving just a bit north in the process. Going back to that link I posted above, there is also something called the Bering Sea Rule, developed by Joe Renken. The Bering Sea Rule states that a storm in the Bering Sea can result in a storm over the United States 17-21 days later. If we extrapolate the January 16th date out using the 17-21 day timeframe, we arrive at a potential storm in the February 2-6 timeframe. This fits well in the February 1-5 timeframe we got from the East Asian correlation, and the nearly west-to-east movement in the Bering Sea tells us the storm in the US may be west-to-east as well, like we saw in the ECMWF forecast. 

The East Asian correlation and the Bering Sea Rule aren't the only things rooting for this storm- the Lezak Recurring Cycle is also in on this storm potential.


The Lezak Recurring Cycle, or LRC, is a tool developed by meteorologist Gary Lezak that, in essence, can enable forecasters to predict the overall weather pattern months in advance. The gist of the LRC involves a cycling weather pattern that develops in October and November of each year; no pattern is the same from year to year. Around mid November, the LRC begins to repeat, meaning we start to see a similar weather pattern in mid November that we saw in early October. This means that the cycling pattern has begun, and it will continue to cycle on a regular (non-changing) 40-60 day interval for the next ~10 months before it dissipates over the following summer.

This season's LRC cycle is on a 57 day cycle length, meaning the weather we saw in December can be expected to "come back" as we enter February. The image above shows the surface condition map on the left and 500mb map on the right from December 14, 2013. If w extrapolate that date out 57 days, we come to the February 7th mark. To make up for natural shifts that occur in the weather pattern, we can reasonably stretch the timeframe out to February 6-8 if we want to. In this case, it wouldn't be the strangest thing for this system to bend the cycle length a bit to fit in with the East Asian + Bering Sea correlations, and I feel that they will be working in sync on this particular storm threat. As the 500mb map above shows, we have high pressure over the West Coast, with only slight ridging in the Southeast and the storm system easily working its way across the Plains. Based on the pattern I'm seeing to start February, I'm thinking a storm track similar to the one this system took in mid-December could very well be in the cards.

Now that we've got the trio of long range predictors backing this storm potential, confidence is rather high on the idea of a storm system happening around February 4-6. Now, we can start to outline a possible track. 


This is the Pacific-North American (PNA) forecast for the next several days, with the forecast shown on the top panel, composed of various ensemble forecast members. We see that the PNA is forecasted to remain negative before, during and after the time period of this potentially significant winter storm. Beyond the storm, it looks like the PNA wants to move back towards neutral or positive territory, but the majority of ensemble members want to stay in a solidly negative state.


The pattern in a negative PNA state is shown above, and we can see how cold and stormy weather invades the West US as a result of persistent high pressure in the Gulf of Alaska. This stormy West then allows high pressure to form in the East, essentially cutting off any chances of a Nor'easter. What the -PNA does allow is the Great Lakes Cutter type storm, where a storm system begins in the Plains and 'cuts' north towards the Great Lakes, laying down potentially significant snowfall in its wake. It's very possible we see somewhat of a cutter storm here- the long range predictor East Asian correlation and Bering Sea Rule argue for a more west-to-east track, which does look like the preferred track at this point, but models may want to shoot the storm north when it hits the Ohio Valley, which also is in the realm of possibility. I'm supporting the more northern track as a result of the Southeast Ridge showing its strength when the system tries to dig towards the Gulf of Mexico.

Now, we have to discuss the models themselves, and where they've gone wrong. Model guidance has really pulled the storm track to the south (though recently they have been correcting north again). I'd like to explain why this south track is unlikely, and why the more northern track is probable.

There's a key model bias that has been (and will continue to) impacting model forecasts for this storm. The model bias references a negative height bias, which is shown when a storm system enters the Plains. In those cases, model guidance lowers heights in the East US too much, leading to a storm track too far to the south. In reality, high pressure systems in the East should be stronger than what they are projected to be on model guidance, leading to a more northern storm track. This system fits the bill for that bias; for the full explanation from the NWS office in Louisville, you can read below:

The model has a slight cold (heights too low) bias, especially for about the eastern third of the country, with respect to the prediction of mid/upper tropospheric geopotential heights and resultant thickness calculations. Often the MRF will dig troughs in the height field too far south across the Great Lakes and Northeast regions, most noticeably after about Day 3. During the cold season (mainly October-April), the MRF will depress the storm track too far south across the Plains states as a response to this cold bias. Forecasters across especially the Northern Plains/Upper Mississippi Valley areas need to be aware of this characteristic and be careful predicting, for example, snowstorms to "go to their south".
How have we already seen this model bias? Take a look at this side-by-side forecast from the 0z GFS model on the left, and the 12z GFS on the right, both forecasting 500mb vorticity values for the morning of February 4th, when the storm is just beginning.
If we look at the 0z GFS on the left, we see the storm system on February 4th is digging into the Plains, but the high pressure in the East US, shown as the arch-like contour lines, isn't strong enough to push the storm system north. This lets the storm system stay to the south and dump snow on the midsection of the US. However, in the 12z GFS, we see what looks like a correction of that height bias we mentioned earlier, as the heights are noticeably higher in the East. This allows the storm to push north and dump snow across the northern US, including the Plains, Midwest, Great Lakes and parts of New England. The negative PNA (whose forecast went even more negative today when compared to yesterday) raises an immediate red flag to the forecasts that want the storm to stay further to the south. The increasing strength of the -PNA projections only highlight that red flag. There are indeed items that could make this storm take the southern track, but I find it more reasonable right now to take that northern track.

We could compare maps all day, but a better idea would be to observe biases from different models and see what we can deduce. Let's take a look at a few charts below.

This image above shows 500 millibar height contours in two different colors, valid at the same time. The blue lines represent observed 500mb heights as of January 29th, while the red lines show 500mb heights from an earlier ECMWF model forecast. This ECMWF model forecast is at Hour 144, and is valid for January 29th; the same time period as the blue lines/observed 500mb heights. Why are we using this? By comparing the observed 500mb heights and ECMWF Hour 144 500mb height forecast (for future reference, I chose Hour 144 because we are about 144 hours away from this potential storm system as of this posting; it is to get the best grip on potential biases), we can find model biases. Just glancing around the image and comparing numbers on a red line to the same number on a blue line tells us that the red lines are far too south. For example, if we see the 552 dam height contour on the red line, and then find the 552 dam height contour on the blue line, we see that the red line is much further south than the blue line. This tells us that the ECMWF model has a bias in this case that forecasts 500mb heights too low. How does this affect our storm? Well, if the forecasted heights are too low, it could mean that the Southeast Ridge will actually be stronger than what is being forecasted, and that would result in a northward track.


This image shows observed 500mb heights in blue and the hour 144 500mb height forecast, but this time the forecast is from the GFS model, not the ECMWF model. Despite the model change, the bias remains the same- comparing the same number on different colored lines results in the GFS forecasting 500mb heights too low. This bias would once again argue for that northward track. The GFS model has been trending north with its latest forecasts, which could mean it is shedding this bias. The UKMET (not shown) also has this heights-too-low bias.

There is also some concern about high pressure coming down from Canada being too strong, which would then force the storm system south. However, model guidance has problems here, too.

This image shows observed mean sea level pressure (MSLP) values in blue, and the ECMWF 144-hour forecasted MSLP values in red. If we look in the Southern Plains, we see a small swath of 1032 millibar MSLP values, indicative of high pressure. But, if we then look for a corresponding 1032mb contour on the red lines from the ECMWF forecast, we see a big swath of 1032mb values displaced a bit to the south. If we keep comparing numbers, the result is the same: it appears the ECMWF forecasts MSLP values to be too strong than what they are when the MSLP values are actually observed. In our case, this bias could mean models are being too aggressive with the Canadian high pressure. Weakening of that Canadian high pressure would then help out chances for that northward track.

If we look at observed MSLP values in blue and 144 hour forecasted MSLP values from the GFS model in red, the bias remains the same. We can clearly see by comparing the location of any pressure contours in the US that the GFS is overdoing high pressure systems when you compare the forecast to what's actually observed. This pressures-too-high bias would really strengthen the argument for that northward track.

Still don't believe these biases (or you just don't get what's going on here)? The two two-panel images below show you computed 500 millibar height biases from the GFS' 0z forecast, which is top image, on the left, and 12z forecast, seen on the top image, on the right. The UKMET (United Kingdom forecast model) 500mb bias' for the 0z forecast (bottom image, left panel) and 12z forecast (bottom image, right panel) are shown.

GFS 500mb model bias.
0z forecast bias on left, 12z forecast bias on right.
Blues mean the model is too low with 500mb height anomalies.
Reds mean the model is too high with 500mb height anomalies.

UKMET 500mb model bias.
0z forecast bias on left, 12z forecast bias on right.
Blues mean the model is too low with 500mb height anomalies.
Reds mean the model is too high with 500mb height anomalies.
The result is quite clear: model guidance is far too low with 500mb heights in the East US. This means that if the bias transfers over to current forecasts (which it very well may do), we can expect a stronger Southeast Ridge in future forecasts, leading to a more northern solution.

As you can see, there's a lot of evidence arguing for these models being too far south in their forecasts. And while I do believe that there's a rather strong case to be made for the models being too south, both due to bias and not getting the incoming negative PNA regime right just yet, there is some evidence that the storm could go south. However, I'm more confident in this northern solution at this time.

But we aren't done yet! Let's talk about how this storm could get to be a monster, and what's prohibiting it as being so on current forecast models.

I. Gulf of Mexico is Open for Business

This is a forecast of the 700mb relative humidity forecast, with 700mb wind barbs and pressure contours superimposed. The point I'm making with this image is not when it was made, but rather what's going on here. Check out that huge moisture fetch from the Gulf of Mexico! Strong winds coming straight from the Gulf will provide this storm with copious amounts of moisture to work with. This moisture will translate into heavy snow, heavy rain, and even sleet and freezing rain. This is a big component of the storm, and thankfully, it is a component that models are not fighting over, unlike what seems like every other part of this potentially significant storm. Needless to say, whoever wins the snowy side of this storm will win big. Not 2 feet of snow, but probably just over a foot or so.

II. Jet Stream Phasing Needed


In order for this storm to really give its all, we will need to see the two branches of the jet stream phase. This means the 'polar jet stream' and 'subtropical jet stream' would need to come together when the storm comes along. Above, I have a GFS forecast showing a lack of phasing on the left, and a forecasting showing phasing occurring on the right. The left image shows the two jet stream branches completely disorganized, obviously separated from each other. That particular GFS forecast resulted in a weak winter storm. However, on the right panel, we see the branches of the jet stream are phased as one, and that particular GFS forecast resulted in a substantially more snowy solution. If we want to see this storm really get going when it hits, we should be rooting for a phased jet stream out west. More recent forecasts aren't as gung-ho on the phasing shown in the right panel above, but they are certainly more open to the idea of combining than the left panel.

Lastly, let's discuss the MJO. 


Another item rooting for this northern storm track is the Madden-Julian Oscillation. The Madden-Julian Oscillation, also known as the MJO, involves the placement of enhanced or suppressed tropical convection year-long. The image on the left shows precipitation anomalies for Phases 1, 2, 3, 5, 6 and 7 for January, February and March. Phases 4 and 8 were left off, as they are not needed in this post. The forecast on the right shows 200mb velocity potential anomalies forecasted by the GFS. We see blues (dashed lines) highlighting active tropical convection, thus an active MJO phase, while oranges and solid lines indicate the lack of tropical convection. We see that there is a swath of blues covered by a dashed line oval at the bottom of the image, near the 180 longitude line. The MJO is predicted to be just west of that line, and if you are to look at the outgoing longwave radiation (OLR) composite for December-January-February MJO phases, you would find that Phases 6 and 7 are defined by enhanced tropical convection (blue colors on the right panel) being placed on or just west of the 180 degree longitude line. Taking a look at Phases 6 and 7 on the precipitation composite on the left tells us the MJO favors a storm track through the Midwest, Great Lakes and Ohio Valley. This would enhance the chances of that northern storm track working out instead of the southern storm track for this storm system.

Here's a glimpse at a recent forecast showing the northern track at this point. To be perfectly honest, it does look rather realistic, with maybe a slight bump up or down in totals in the near future.


Don't forget to like us on Facebook and follow us on Twitter!

Andrew