Friday, April 5, 2013

April 8-10 Significant Tornado Outbreak

Critical Storm Action Days may be needed for this event. For those who don't know, a Critical Storm Action Day (CSAD) means all resources here at The Weather Centre are devoted to the severe weather event. No other unrelated posts will be published.
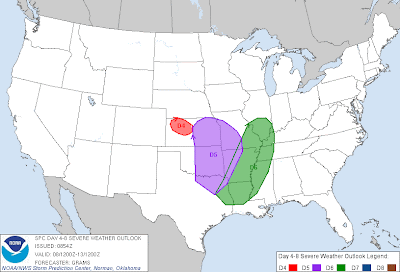
I have decided to go ahead and change the title of this event to a 'Significant Tornado Outbreak' in light of strong Storm Prediction Center discussion wording, very favorable projected soundings, and the wind fields from different levels of the atmosphere.

The Storm Prediction Center in Norman, Oklahoma has released three areas highlighted for a severe weather event in the long range forecast. The three areas are highlighted for April 8th, 9th and 10th, and I have used those dates to make the appropriate dates for this post. First area of interest is in northwest Kansas, where the storm system may put out an area of severe weather the day before the big show begins. The big story is late in the evening on April 9th into the overnight hours and morning of April 10th.

Strong jet stream will punch into the Plains with this system to allow upper air support to a severe weather event. Wind speeds well over 100 knots will be focused in the immediate vicinity of this severe weather event for April 9th. Jet streak of 120 knots appears to be pushing north and east with the movement of the storm that will most likely aid in more enhanced tornado development in Arkansas and portions of MO/OK. Extrapolation of this image would have the jet stream slide up the stream and eventually depart overnight to possibly aid in thunderstorm development further north into the Midwest;  however the extent of that potential is yet to be seen.

Lower level winds will be howling above 50 knots in the areas where severe weather development is expected. Weaker winds in the 40-50 knot range are encompassing nearly the entire area outlined in purple by the Storm Prediction Center for this outbreak on April 9th. Main concern rests in areas where lower level winds are maximized- I feel it is these areas that will have the most support for tornadoes and general severe weather. Certainly cannot count out a strong, long-tracked tornado with this event. Wind shear will be enhanced from border to border to allow for the thumbs-up for tornado potential. The more wind shear is present, the more favorable the environment becomes for tornadoes. These favorable upper and lower level wind fields, combined with the widespread elevated wind shear tells me many are in for a rough ride come Tuesday.

Sounding from central Arkansas valid for the evening of April 9th unveils a loaded gun sounding. The loaded gun sounding is signified by a slight capping inversion (yellow line to the left of the red line) just above the surface, with high instability above that capping inversion (yellow line far to the right of the red line). The name 'loaded gun' comes from the idea that the 'gun' (severe weather) could fire at any time- the trigger (capping inversion) just has to be pulled (erased). As soon as that capping inversion is erased, the severe weather gets going. Typically, you will see a loaded gun sounding that is much stronger, where the yellow line is much farther away from the red line than what you see above. What you see above is an 'okay' loaded gun sounding. Regardless, the mere presence of the loaded gun sounding indicates that severe weather is targeting this area. Looking at a few choice parameters on the righthand side of the sounding, we see just over 1300 units of CAPE (instability). That number isn't too high compared to what you can see in spring, but considering this is the first outbreak of the season, it isn't too shabby. Just below the 'Wind' section, the STM (storm motion) parameter is at 237/37. This means the storms will be moving from the southwest and to the northeast (237 degrees on a compass points towards the southwest), while the number 37 refers to how fast the storm will be going in knots. The last value of the numbers is BSHR, which indicates bulk shearing. We see that at a solid 96, meaning there will be quite a bit of shearing in the area- a big tornado factor. PW (precipitable water) will be at 1.66 inches, a very humid atmosphere thanks to the flow from the Gulf of Mexico. The BRN (Bulk Richardson Number) is in the teens, which is the prime range for severe thunderstorms. The EHI value is at 3- the higher the number, the more rotation and energy there is in the atmosphere (thus, the higher chance of a tornado). 3 is considered a solid amount of rotation and energy.  HEL shows helicity, the pure spinning of the atmosphere. That value rests at 365, quite a high number and conducive for tornadoes.

Have finally added a 'Severe' demarcation to the graphic to highlight where the highest chance of overall severe weather is. Also added a red delineation to highlight where I believe the best chance of tornadoes will be. I am concerned for the Arkansas area and surrounding regions as far as tornado potential goes, I fear that lives may be lost if enough rotating thunderstorms can form and mature to become supercells. Other than those two additions, the ERI graphic was not changed. Will likely have a special graphic out tomorrow to highlight the specific tornado threat.

Please share this with friends, coworkers and family- this is the first severe weather outbreak of the season, and it could be a tornado outbreak. Many are likely unprepared.

Andrew

Thursday, April 4, 2013

April 8-10 Potential Tornado Outbreak

Confidence has grown to a degree where I do believe we will see the first severe weather outbreak of the season. Title may have to be changed to reflect a tornado outbreak if model guidance remain sturdy with current forecasts.

The Storm Prediction Center in Norman, Oklahoma has issued a long range severe weather outlook for the looming severe weather outbreak that is likely to be the first outbreak to open the severe weather season. Discussion from the SPC indicates instability and favorable mid/upper air wind field will allow for the formation of severe weather across the western half of Kansas. Discussion goes on to say that model differences include the evolution of storms, and whether they will congeal into a cluster of severe storms or remain as individual supercells. End of discussion illustrates that additional areas will need to be outlined in the future if current forecast trends continue. Below, we will see what this storm involves.

Strong storm system will eject from the Southwest into the Plains to provoke the biggest warm-up of the season for those in the Midwest and east. Above image (and all forthcoming images) is valid for the evening of April 9th. This particular graphic shows the projected jet stream forecast for the evening of the outbreak. We see the Pacific jet stream plummeting south to intercept the storm system, and in the process set up an upper-air wind field appropriate for a severe weather event. A few concerns ride along with this jet stream set-up. Main concern is the Pacific jet stream actually dropping the storm due to how far south the system is. Previous forecasts have shown this concern coming to light, with the jet stream preferring to ride into Canada rather than drop south into the southern Rockies. Second concern is the lack of the subtropical jet stream's presence. We can see it as a weak band of winds in Mexico and just hitting southern Florida. If the subtropical jet stream were to phase (merge) with the Pacific jet stream to intercept this storm, it is highly likely this event would be much more intense than what we are currently looking at.

Lower level winds just 10,000 feet above the surface illustrate banding patterns of where we may find the strongest thunderstorms. Ribbons of winds above 50 knots are found in Arkansas into Iowa, as well as eastern Kansas and even trying to push into western Missouri. These enhanced lower level winds will allow thunderstorm development to gain more support as far as potential for severe weather goes. In this format of lower level winds, the presence of tornadoes and other forms of severe weather would most likely increase as the night wears on. Current concern area aligns with the lower level wind ribbons, and I expect the overnight hours of April 9th into April 10th to be favorable for severe weather, now in both the upper and lower wind fields.

Crossover image of winds 10 meters above ground (red wind barbs) and winds at the 500 millibar level (blue wind barbs) shows a new side that makes me more suspicious that this outbreak will be pretty tornado-oriented. If we examine the southern Plains states of Missouri, Arkansas, Oklahoma and Kansas, we find that the wind barbs are generally at anywhere from a 45 degree to 90 degree tilt away from each other. This separation means the wind direction varies between these levels, one of the two components of wind shear. The second component, difference in wind speed from one level/barb color to another, is more easily found in the aforementioned states. Largest change is in Kansas, where we see a blue triangle, two long lines and one short line on a barb (triangle= 50 knots, long line= 10 knots, short line = 5 knots) to make 75 knots against a very weak red barb (15 knots total). Still-substantial speed changes are found in Arkansas, Oklahoma and Kansas, where differences in speeds are at least 40 knots in many places. It is these direction and speed differences that tell me there is certainly a tornado threat lurking in the shadows.


Both of the above graphs are from central Arkansas. The top image is called a sounding, and the bottom image is called a hodograph. On the sounding, we can identify a few things that focus in on the idea of a severe weather event. First and foremost, we look to the bottom of the sounding itself and to the gap between the solid red line and dashed red line. This gap between the two lines is instability that fuels thunderstorm development. The larger the gap between these two lines, the more instability is available. In this forecast sounding, we find a pretty large gap between the two, and model forecasts confirm there will be adequate instability for a severe weather event in this part of the nation. On the right side of the sounding image, we see a bunch of wind barbs, from the surface to the far reaches of the troposphere. Recalling our wind speed and wind direction rules for wind shear, the right side of the sounding with those wind barbs is where we look for identifying areas with the highest wind shear. If we examine the wind barbs from the surface to roughly 700 millibars, we see that the direction certainly changes from the surface to 10000 feet above ground, but it is the speed change that is most startling. We see at least a 30 knot wind change from the surface to just a couple thousand feet above ground- that's some serious lower level wind shear!

As far as the hodograph, the projected wind pattern is shown as if the weather balloon was sent up into the atmosphere, and its location was recorded at a certain interval. When you see a wide stretch between one black dot and another on the hodograph, that signifies strong winds. When you start seeing circling patterns, whether they are full circles or just semi-circles, that is a very positive sign for tornado development. The circling pattern means the winds are spinning as you move up the atmosphere. If you imagine how a traditional corkscrew looks with the metal helix, that is essentially what the wind pattern in the atmosphere is doing, and it is this pattern that is most conducive for tornado development. This particular hodograph, valid the evening of April 9th in Arkansas, shows multiple circling patterns as you go up the atmosphere, meaning the chance for tornadoes in that area is on the rise!

Lastly, we go down to the surface and look at projected precipitable water (PW) values for the evening of April 9th. The storm system is clearly shown in central Kansas as the higher PW values wrap around the central part of the state. Further down to the south, precipitable water values surpassing 1.5 inches are found in eastern Oklahoma and eastern Texas. These high and humid values can only be obtained from one place- the Gulf of Mexico. It looks like the Gulf will be open for business for this event, enabling this storm system to gain tremendous amounts of moisture. As we know, moisture is one of the necessary ingredients for severe weather in general. In this case, it really is the more the merrier.

Exclusive Risk Index (ERI) is pinpointing a 'Low' risk of severe weather for the Upper Midwest, just east of the Front Range in Colorado, and down to southern Texas. 'Elevated' risk of severe weather exists from Kansas and Nebraska eastward into central Illinois and Kentucky. The risk area continues down into the Gulf Coast and stays along the coast to encompass a large portion of the Plains, Midwest and Gulf Coast in the potential area for Elevated severe weather. A fairly large area of 'Enhanced' severe weather goes from Kansas, which appears to be the starting point for this multi-day outbreak, south and east into much of Oklahoma, Missouri, Arkansas, and portions of LA/MS/TN/KY/IL. Exact severity of this outbreak is to be determined, but the option to upgrade this event's title to a Tornado Outbreak remains on the table.

Andrew

Tuesday, April 2, 2013

April 9-10 Potential Severe Weather Outbreak

We appear to be facing the season's first severe weather outbreak on April 9th and 10th.

Model guidance indicates a strong storm system will eject out of the Southwest and into the Southern Plains to start off the second week of April. As it does so, a band of strong winds in the jet stream (pictured above) will shoot northeast on the east flank of the storm system. It is these upper level winds that will aid in what I am predicting to be the season's first severe weather outbreak. I anticipate the upper level wind field to exceed 100 knots, as the forecast graphic above shows. For future reference, this and all forthcoming graphics are valid the evening of April 9th. With the upper level wind support, we have one of many pieces to the puzzle of making a severe weather event.

We now continue on to something called Deep Layer Shear, or DLS. As you know, shearing is one of the necessary ingredients for tornado formation, and also for severe thunderstorm formation. The higher the shearing, the stronger the storms. Looking at the layout on the forecast image, we see the highest shearing extending from central Texas into Missouri and even into Iowa. The highest shearing appears to be along a forthcoming cold front that will kick the nation's first round of springtime temperatures out. With springtime temperatures present when the cold front comes through, the cold front should react like a springtime cold front- strong and possibly severe. With the highest shearing centered to the south, the largest tornado threat would be confined to the Southern Plains at this time.

Continuing to work our way down the atmosphere, we arrive at the 700 millibar layer, best known for the layer which holds the nocturnal lower level jet stream, or LLJ. The lower level jet stream is just what the name says- a smaller, weaker jet stream at a lower level of the atmosphere. Looking at the chart above, we see our storm system shown in Nebraska. We can identify that the storm is roughly in that region, as the pressure contours begin to close off and center themselves, indicating the presence of lower pressure and thus our storm system. The wind field is rather quiet around the north and western sides of the storm system, but it is the southeastern flank of the system where we find high wind speeds. A glance at the legend on the left tells us we are dealing with winds above 55 knots. As a rule of thumb, when you have high lower level winds and high upper level winds, the chance of severe weather is greatly increased. Of course, other atmospheric factors have to be present to provide for the severe weather, but a solid wind field certainly helps. These high lower level winds are most prevalent in Arkansas, north of the Gulf Coast. I want you to take note of the location of those lower level winds, as we will discuss it a bit later on in this post.


We now arrive at the surface. On the top are predicted dewpoint values for the evening of April 9th, and on the bottom are precipitable water values in colors, high and low pressure system denotations in their respective letters, and 850 millibar wind forecasts in the light gray wind barbs. The general idea of these two charts is clear; we are dealing with the availability of moisture. I pull these two up together, as they are closely intertwined and both are required for severe weather production. Basic meteorology states higher dewpoints means higher moisture. In the same sense, higher precipitable water (PWAT) values indicate higher humidity (you may have heard your TV weatherperson say that there is the equivalent of 1.3 inches of water in the air on a humid day- that is precipitable water). There are a few things we can draw from these two images. The first is that this storm system, wherever it ends up, will have the Gulf of Mexico open to draw loads of moisture north to provide a moist base for severe weather. This is clearly reflected in the high dewpoints and PWAT values across the Plains and southern Midwest. One other thing we can deduce from the second image in particular is how strong the lower level wind field will be. We already discussed the lower level jet stream, but these wind barbs are for the 850 millibar level. You may recall the 850 millibar level is 5,000 feet above ground, while the 700 millibar level is 10,000 feet above ground. As far as finding out what wind speeds those wind barbs are predicting, each long line is 10 knots, each shorter line is 5 knots, and each triangle is 50 knots. For example, we can see a few triangle wind barbs in Louisiana, Arkansas, Texas and Oklahoma. Not only does that mean 50 knot wind speeds just 5000 feet above ground (AG), it also means a very windy day here at the surface if this forecast were to verify.

So we've figured out that the models are pretty excited about this event- they've been showing it (albeit not extremely consistently) for multiple forecast runs now. But is it possible we could get some clues from the past on where this severe weather event may go?

The answer is yes.


If you think back to Christmas Day 2012, there was a severe weather outbreak that spanned much of the Gulf Coast. The event began in Texas with a tornado reported in Houston, continuing and strengthening on east through Louisiana, Alabama and Mississippi. A very wild day as most of the severe weather reports were tornadoes and damaging winds, as the archived Storm Prediction Center report chart shows on the bottom image. The top image illustrates the 500 millibar overview on the evening of Christmas Day. The storm system was plowing through the Gulf Coast, with the severe weather out in front.

Many of you know me as an advocate of the repeating pattern of the Lezak Recurring Cycle (LRC). This year's cycle length is approximately 53 days long, and if we count back two cycles (106 days), we arrive a within a day or two of Christmas Day. What does this mean? This means that this upcoming severe weather event could be happening in the same pattern that the Christmas Day severe weather outbreak occurred. Ergo, this upcoming severe weather potential could echo the Christmas Day event (not specifically in strength, but in overall pattern). One thing that should be noted is that the April 9-10 storm looks to be further north than the Christmas Day storm. This would mean the severe weather should then be further north as well. It's too early to name states and areas that could be affected, but my faith in this event's potential is growing by the day.

Andrew

*Note- the connection to the LRC was made by the members of the AccuWeather Forums.

Monday, April 1, 2013

First Severe Weather Outbreak On The Horizon

The first solid severe weather outbreak of the severe weather season appears to be on the horizon.

Medium range model guidance is indicating that a storm system will come onshore from the West Coast to kick off the second week of April. As the image above (valid for April 9) reveals, the storm will then travel east and into the Southern Plains. As this happens, high pressure in the East US will be pushed away towards the Atlantic Ocean, leaving warm air spread out east of the Mississippi with nowhere to go. Since spring is around the corner, a good cold front should arrive and could very well bring the first severe weather outbreak of the season. Let's look closer at different factors going into this event.

We'll start with the upper layers of the atmosphere and work our way down. Pictured above is the forecasted jet stream position for the same timeframe as the first graphic. We see our storm system clearly outlined by the large dip in the jet stream, beginning to push east. At this particular timeframe, our storm system is beginning to wrap a band of enhanced jet stream winds into its southern flank. This is shown by the darker greens and light yellows found in southern Arizona, New Mexico and Texas. As the storm system pushes to the east, this band of higher winds will also. I anticipate these higher winds to push into Arkansas and into the Gulf Coast/Midwest regions as time goes on. With these strong upper-level winds pushing into the region where the cold front may ignite thunderstorms, the storms could gain a stronger stance if the upper level winds cooperate.

We now move onto the projected shearing values for the evening of April 9th. It is worth noting that a rule of thumb in severe weather forecasting is that higher shearing values means a higher tornado risk if the rest of the atmosphere is cooperating. We see the highest shearing levels placed from north central Texas into Missouri and Illinois, forming an upside-down horseshoe in a similar formation as the projected jet stream position for nearly the same time. Because we are seeing the highest shearing values just along the projected cold front, there is certainly reason to think any potential thunderstorms would get a boost of energy from both the favorable jet stream winds and enhanced shearing values.

Continuing to work our way down the atmosphere, we arrive at the 700 millibar mark, the area best known for watching the lower level jet stream. The lower level jet stream (LLJ) is the main driver of severe weather when you find out some nasty weather may be headed your way overnight. If you know that the sun heats the Earth during the day to give energy to the storms, you may ask how they can keep going at night. The nocturnal lower level jet stream is your answer. This graphic is for the 700 millibar level, showing projecting winds for the evening of April 9th. We see the strongest winds are centered in southern Illinois, with still-formidable with speeds stretching across Missouri, Arkansas and into eastern Oklahoma. You can see the location of the storm system with the multiple circles in the central Plains, and the location of these high winds to the immediate east of those circles tell me these high winds will be right in the area for thunderstorm formation. These high winds increase my concern that this could be a solid severe weather event, possibly even reaching outbreak level. I will discuss how that outbreak level will become more likely as we keep going.

Now shown are projected precipitable water values in millimeters for the morning of April 9th. We see our storm system in the central Plains (denoted with the L) and our precipitable water values in colors. Winds 5,000 feet above the ground are shown in the gray wind barbs. Take a look at what you see:  those pale yellows are high precipitable water (PW) values being drawn directly from the Gulf of Mexico. With abundant moisture being a crucial ingredient in severe weather, this system could certainly have enough moisture to put on a show of severe weather. An analysis of instability maps for this same timeframe reveals enough energy is projected to be present for the season's first real opportunity at a synoptic severe weather event. The wind barbs for 5000 feet above ground are screaming at a maximum 67 knots, meaning the moisture flow will be intense. If this forecast verifies, we will most likely be looking at a good severe weather day for storm chasers.

Natural caveat is we are 8 days away and the forecast will change, but with the pattern looking more active in the long range, this sort of situation could happen more than once!

Andrew

Pattern Looking Warmer, More Active

The overall weather pattern for the United States looks like a solid warm-up is on the way, and with it a more active storm pattern.

We start with the forecast for the Arctic Oscillation, valid over the next several days. The black line shows the current forecast, with the other colored lines indicating past forecasts. We see that the forecast for the Arctic Oscillation is another dive to deep negative territory, followed by a tremendous spike into positive territory. If you'll notice, we have had a negative Arctic Oscillation for a while, which means high pressure is stationed over the Arctic. When the Arctic Oscillation (AO) is negative, cold air is more encouraged to hit the United States, and this effect has been shown greatly over the past few weeks. If you want something to blame for the chilly start to spring, this is your culprit. The spike to positive territory means we should see low pressure building back over the Arctic, allowing for warmer air to flow back into the nation.

Another index we can look to for temperature guidance is the Madden-Julian Oscillation, or MJO. The MJO involves the location of convection along the equator in the Pacific Ocean. Each phase indicates a different location for this convection, and each phase affects the US differently. For example, when the MJO is in Phases 8-2 in the winter, we can expect cold weather. We see the index moving into Phases 4 and 5 in coming days, as shown above by the European model. These phases in the springtime tend to favor a slightly warm/slightly cool nation, switching back and forth depending on the strength of the phase. We see that the MJO is close to the circle at the center of the image, meaning it will be weak when it enters these phases. Nonetheless, I expect the incoming warm trend to be assisted at least slightly by the MJO. With the MJO in Phases 4 and 5, storms in the West can also become more common, which then forces high pressure formation in the East. This trait usually shows itself in the winter, but could also become present in early mid-spring.

A third, more complicated index can explain what the models are seeing. Shown above is something called the Earth AAM Tendency chart. Without going too deep into this complicated index, the Earth AAM can help us predict incoming temperature patterns. It appears that when the Earth AAM (EAAM) is negative, colder weather becomes more prevalent. In the same sense, a positive EAAM favors warmer weather. Recently, we began seeing a spike in EAAM Tendency values not seen this year. The fact that the Earth AAM Tendency is strongly positive means the Earth AAM itself should also begin to rise to more positive values, helping along the warmer pattern that will be ushered in.

The Climate Prediction Center is on board with this warm-up, predicting over a 60% chance of above normal temperatures across the central and eastern US. The higher the probability, the more likely a strong warm up will occur. With the pattern beginning to favor a stormy West US, it is only logical that we would see a warm and quiet East. This quiet will only last for so long- the storms in the West have to go somewhere. The storm systems beginning to progress east into this warmth then allows us to confront the potential of multiple severe weather events, the first of which is on the horizon and can be seen on the blog.

Andrew