Wednesday, December 11, 2013

December 19-23 Potentially Significant Winter Storm

I am rather confident that we will see a winter storm in time for the December 19-23 period, and there is a chance it could be significant.

A pretty strong storm system is expected to move across Japan in 48 hours, after dumping multiple storm systems over that area in the past few days. This storm system is looking healthy, as defined by the GFS ensemble mid-level height anomaly forecast above over Japan. As I have mentioned on this blog, there is a 6-10 day correlation between weather that occurs in East Asia, and weather that occurs in the United States. Thus, with this forecast image, we arrive at the December 13th date. Go ahead 6-10 days, and we find the potential storm timeframe of December 19th to 23rd. The reason I believe it may be significant is due to the strength of this system on the image above. Unlike the upcoming weekend storm, which saw only a moderate system in East Asia 6-10 days prior, the current East Asian projection is for a strong storm to hit Japan, and long range model guidance senses that this system will also be a strong one for the US.

The ECMWF model delivers a very strong system to the Midwest, Great Lakes and Ohio Valley before shifting northeast to hammer Canada. As is denoted above, there could be some heavy snows north of that dark blue 32 degree temperature line. This would put the states of Illinois, Indiana, Michigan and Ohio in line for such snows, though we remain roughly 10 days away from this potential storm. I'll discuss a little more on the atmosphere surrounding this system later on in this post, but for now, you snow fans can take a look at the total snowfall projection for this storm below.

The ECMWF isn't the only model showing a potential winter storm for this timeframe. It's global model rival, the GFS, is also in on it.

GFS precipitation forecast for December 20th, 12 hours earlier than the ECMWF image above.
The GFS image shown above details 12 hour precipitation totals for this storm, and you can clearly see the wide swath of potential heavy snowfall across Illinois, Wisconsin, Michigan and Indiana. The GFS model has the low pressure system in Kentucky 12 hours after this image, whereas the ECMWF has the system in central Indiana. The GFS being on a more southern track does mean the snowfall would theoretically be suppressed south, but the wide precipitation shield on the image directly above gives away the GFS' projected snowfall, which is shown below.

GFS 48 hour snowfall totals for this snowstorm.
My thoughts on this storm system are actually of rather high confidence right now. This strong Japan storm system is more likely than not to translate to a storm system (if not a strong storm system) for the United States. Once it enters the United States, it is most likely going to drop down into the eastern Rockies (think Colorado).

This relative measure of predictability map, from the NCEP, gives us a glimpse at what atmospheric conditions are likely to be unfolding by an assortment of colors, defined in likelihood by the legend at the bottom. In this case, we see that blues have a single or low double-digit percent chance of verifying, while oranges define close to a 50% chance of verification. This map is valid on the evening of December 19th, roughly two days before this storm is projected to strike.

If we look around the map, we first notice a wide swath of oranges across the Gulf of Alaska. A glance at height contours tells us there is ridging forecasted in that area for the evening of December 19th, and the presence of widespread oranges tells us that the ensembles are at least decently confident in that atmospheric factor verifying. The effect that Gulf of Alaska ridge has on the potential winter storm is that the system should follow the contour lines and drop south into the Rockies. It is unable to drop too far south into the Southwest, as a positive North Atlantic Oscillation (NAO) will keep the pattern more progressive, and thus more west-to-east (hence the relatively flat contour lines over the United States). The second item we observe is a stripe of orange extended from southwest Canada into the central and western Rockies. This looks to be the potential storm system, as it dives southward towards the Rockies. The oranges tell us there is rather high confidence, which is a good sign for the storm prospects. The third (and possibly most important) item is the swath of oranges over the Southeast. It may not look too impressive, but there is likely to be high pressure stationed over the Southeast as a result of storminess over the West.

The image above is what is referred to as a negative Pacific-North American index phase (or -PNA for short). The negative PNA results from that ridge we discussed in the Gulf of Alaska that then produces storminess/troughiness in the Western US. In response to that West US storminess, we then see the development of high pressure in the Southeast. The jet stream in this situation takes storms from the West and runs them north and east, typically delivering snow to the same areas that were outlined by the GFS and ECMWF earlier in this post. Considering the relative measure of predictability chart has high confidence (for being nearly 10 days out) in the Gulf of Alaska ridge, the storm itself entering the Rockies, and the ridge in the Southeast, I do think that the GFS and ECMWF solutions are two very possible solutions.

Let me explain why I think we could see the GFS or ECMWF work out in terms of storm track and snowfall amounts.

1. The East Asian storm system is strong. Typically, we see weak or moderate storms in Japan translate to weak or moderate storms in the US. Now that a strong system is headed for the area, it is quite possible that this winter storm is strong as well.

2. Models appear rather confident with the environment surrounding this storm system. This negative PNA environment is looking like its gaining confidence in the GFS ensemble set, and a look at the ECMWF ensemble prediction system seems to agree on both the set up and the storm system actually occurring.

3. All put together, the environment looks ripe. This one is mainly thanks to the East Asian component, but when you look at the overall picture of the mid-levels, a storm track favoring the areas depicted by both modeling systems does appear to be a viable solution on either guidance system.

It's a bit too far out for me to give a graphical outlook, but I think you get the gist here- there is some mighty fine potential with this system.

Andrew

Tuesday, December 10, 2013

December 13-16 Potentially Significant Winter Storm

It's looking very likely that there will be a snowstorm for the nation between December 13 and 16, and there is a decent possibility that it will be significant.


The operational ECMWF model projects the event to be a result of two separate pieces of energy- one from Canada, and one from the Southwest. You can see the Canadian energy shown as the white streak pointing southwest-ward into Kansas, and the Southwestern energy depicted as the dip in the contour lines in far southern Missouri. It is expected that these two systems will bring the potential for anything from a winter storm, to a monster of a winter storm. But that isn't shown here because of some disagreements.

Model guidance is in disagreement on the track of this system, as well as the question to if it will phase (merge). The idea here is that if the two pieces of energy are able to emerge from Canada and the Southwest, respectively, at the right times, then they may combine to form a potentially significant winter storm system. However, some model guidance prefers to either phase the systems further to the east, giving the northern Ohio Valley some very heavy snows, or not even phase them at all. I'm not sold on this non-phasing idea, and to be honest, I think the systems will actually phase further west than what is being shown. Why? I'm glad you asked.

Teleconnection projections for the Pacific-North American index (top left), the North Atlantic Oscillation (top right), the West Pacific Oscillation (bottom left), and the East Pacific Oscillation (bottom right) are shown in the image above, composed by the Earth System Research Laboratory, or ESRL. Taking a look at the PNA forecast for the December 13-16 timeframe, we see the index moving towards positive territory, but not really getting there in time to flip the Pacific North American index from negative (unfavorable for a huge East US snowstorm) to positive (favorable for a East US snowstorm).

NCSU
Now, the negative PNA means that high pressure will be present off of the West Coast, so the mid-latitude jet stream will be able to dive south to deliver storms to the Rockies. An additional jet stream system (you weather junkies know it as the subtropical jet stream) that tends to stay around the Deep South is pushed northward due to the emergence of high pressure in the Southeast. If you look towards the middle of the nation, we see those two jet stream systems pairing up and moving northeast. You guessed right; such a development would support the earlier phasing (or at least some form of phasing) idea I illustrated earlier. But we've only scratched the surface.

Going back to the ESRL teleconnection forecast, we see that the NAO is projected to be positive throughout this timeframe. This positive NAO will keep the overall weather pattern quite progressive, meaning the probability of stagnating high and/or low pressure systems is lowered. Usually, this would go against the idea of the two pieces of energy phasing, but if the progressive flow can limit the ridging in the Southeast provoked by the negative PNA, it's possible we see a very ideal set-up for the phasing of these two storm systems.


There is also the idea from model guidance that a secondary low pressure system may form over the waters off the Northeast to produce a very snowy situation for much of the Northeast. I am skeptical of this idea for a few reasons, one of the more pronounced ones being the presence of that positive NAO. Usually, a positive North Atlantic Oscillation is progressive and does not support the formation of these coastal Nor'easters. Adding to my skepticism is how models are doing really poorly with the conditions in the Pacific right now, where the energy for the main storm and possible secondary low is. Thus, model guidance for both events isn't really being viewed as entirely trustworthy. I'd like to wait for the models to work themselves out on this initial storm first before we open the idea of a secondary low forming in the Northeast. I'm not completely shutting the door on the idea, but I'm also not exactly in favor of it just yet.

Adding to my thinking that these two pieces of energy may very well phase more east than is currently projected is because of a very prevalent model bias among global modeling systems.

It has been determined by meteorologists who carefully analyze and work with the models that there is a tendency for models to eject energy coming out of the Southwest too quickly than how it actually ends up unfolding. This means that it's very possible (some would even say likely) that the two pieces of energy I pointed out at the top of this post may look very different- the energy coming from the Southwest may end up further west than the current solution shows for the timeframe above, which is early on Saturday morning. I do think that the models are displaying this bias yet again, and the trouble in the Pacific doesn't help a bit, as I'll explain below. If we do see a slowing down in the model solutions with that Southwestern energy, expect the chances of a phasing solution to be on the rise, and the possibility of an even bigger storm rises as a result.

The issue with the Pacific is that we don't have nearly the amount of sampling in the Pacific like we do in the United States. What's sampling? It's what happens when the National Weather Service offices send up the big weather balloons twice a day, with monitors attached to them. Unfortunately, we don't have any of these NWS offices in the middle of the Pacific- we only have buoys, commercial aircraft, and satellite measurements to give us a rather mediocre depiction of what's happening in the Pacific, as is explained by Cliff Mass in his blog post. I say mediocre, because while those buoys, satellites and commercial aircraft do help in giving the models some data to work with, they are nothing compared to the radiosondes that go up with the weather balloons. That said, I expect models to be dicey with this storm for the next couple of days, before the energy gets into the network of radiosondes, which should greatly help model accuracy.

Speaking of model accuracy, take a gander at this discussion of the models from the Weather Prediction Center on this storm:

...PROGRESSIVE TROUGH ARRIVING ON THE WEST COAST DAY 2...
PREFERENCE: BLEND OF 12Z CANADIAN WITH 00Z ECMWF ENSEMBLE MEAN
CONFIDENCE: BELOW AVERAGE

A PROGRESSIVE TROUGH OF SHORT TO MEDIUM WAVELENGTH WILL ARRIVE
ALONG THE WA/OR/NORTHERN CA COASTS BY 13/00Z. THE CHARACTER OF
THIS SYSTEM...COMBINED WITH ITS INITIAL POSITION OVER THE DATA
VOID IN THE PACIFIC...IS CAUSING SOME DIFFICULTY IN THE MODELS.
THE GFS AND NAM ARE CERTAINLY FLATTER...GIVING THEIR SOLUTIONS A
LITTLE EARLIER ARRIVAL TIME ON THE COAST. THEY ALSO TAKE HEIGHT
FALLS EASTWARD INTO UTAH WITH LESSER HEIGHT FALLS GRAZING NORTHERN
ARIZONA. MEANWHILE...THE ECMWF AND CANADIAN INDICATE A MUCH MORE
PRONOUNCED SPLIT OF THE UPPER ENERGY BEGINNING LATE ON DAY
2...ALLOWING A ROBUST SHORTWAVE TO DIG FARTHER SOUTH. SOLUTIONS
FROM THE CANADIAN ARE RELATIVELY CONSISTENT...AND DIG THIS TROUGH
TOWARD WESTERN ARIZONA...AN IDEA THAT HAS SUPPORT FROM SEVERAL OF
THE 00Z ECMWF ENSEMBLE MEMBERS
. THE OPERATIONAL ECMWF SHOWS MORE
RUN TO RUN VARIABILITY...THOUGH...AND HAS BEEN ONE OF THE
DEEPEST/FARTHER WEST SOLUTIONS. THE 12Z RUN...IN FACT...CLOSES A
CIRCULATION BACK OFFSHORE OF SOUTHERN CALIFORNIA BY 14/00Z. ONE
COULD SAY THAT THE 12Z UKMET SUPPORTS THE ECMWF...BUT ONLY
LOOSELY...WITH THE UK SOLUTION BEING EVEN FARTHER WEST AND COMING
ON THE HEELS OF A 00Z RUN THAT WAS LESS THAN INSPIRING/WAS A SLOW
OUTLIER/. GIVEN THE AMOUNT OF UNCERTAINTY...WE RECOMMEND A BLEND
THAT GETS TOWARD A MIDDLE GROUND SOLUTION. IN OUR FINAL PREFERENCE
WE REPLACED THE GFS WITH THE CANADIAN...AS THE GFS NOW APPEARS TOO
FLAT/PROGRESSIVE VERSUS THE FULL 12Z SUITE.

The consensus does appear to be that models are really having trouble here, and the WPC recommends going with today's GEM (Canadian) model, as well as last night's ECMWF ensemble grouping. Because I'm always a bit suspicious of the GEM model, we'll take a look at what last night's 0z ECMWF ensembles say.


The 0z ECMWF Ensemble set has this storm system traveling from Arkansas to Ohio, as I outlined with the yellow arrow. Such a set-up is very conducive to heavy snows in the Lower Great Lakes, Midwest and Ohio Valley, though the ensembles only drop a handful of inches of snow from Illinois to Indiana before the system really gets cranking further east. Again, that southwest bias is still in play here, so I'm skeptical about this solution (and all others) as well.

Here's my preliminary outlook on this system, subject to potentially drastic change.

Andrew

Monday, December 9, 2013

December 13-16 Potential Winter Storm

There are hints that there may be another winter storm across the Midwest and Northeast through the December 13-16 timeframe.

The GFS model has a storm system moving north and east across the lower Midwest and towards the Northeast, as is shown by the elevated vorticity values over the Kentucky, Illinois, Indiana and into Tennessee. The GFS prefers to develop this storm system, and moves it northeast over the ridging in the Southeast, giving the Midwest, Lower Great Lakes, Ohio Valley and Northeast another round of snow. Given that the pattern does support this storm track, I do think that this is within the realm of possibility.

The ECMWF, at the same timeframe as the GFS image above, has this energy more elongated than the GFS, and it is not developed correctly as a result. Both model systems have ridging over the West Coast, as well as ridging in the Southeast, which is why I find this solution rather peculiar. I think the ECMWF may not be correct in its analysis of the system. Let's discuss why below.

For one, the ECMWF ensemble set (ECMWF EPS) follows the same track (drawn in yellow) that the 12z GFS put up earlier today. Both model guidance sets have the storm system traveling from northern Mississippi to West Virginia. Looking at the deviation on the image above, it does look like the ensemble members agree with the GFS, with dark blues rather than light blues (which would indicate low confidence in the solution) showing up for this potential storm. If we are to go by the idea that the ECMWF EPS and GFS are pairing up for this potential winter storm, we can take a look at the overall storm projection from the GFS and see what both guidance systems may be thinking:

Note, this storm would bring snows to the northern Northeast regions, not coastal states. Subtract an inch or two from western New York, VT, NH, ME, northwestern PA to get snow from only this storm. 
As the GFS projects above, this storm would bring plowable snows from much of Illinois to Indiana, Michigan, Ohio, Pennsylvania, New York, Vermont, New Hampshire, and Maine. I don't have the figures on the ECMWF ensemble snowfall (not sure if anyone has access to that), but based on the storm track from the GFS and ECMWF EPS matching up so well, I would think that snowfall orientation would be the same, stretching from the Midwest to the Northeast.

I'd like to wait for a bit more consistency before putting in more confidence to this system, which would include the GFS and ECMWF EPS matching up again on this system, and even the ECMWF operational model jumping on board.

Andrew

Sudden Stratospheric Warming Incoming

It does appear likely that a stratospheric warming event is in the works for the next week or so.

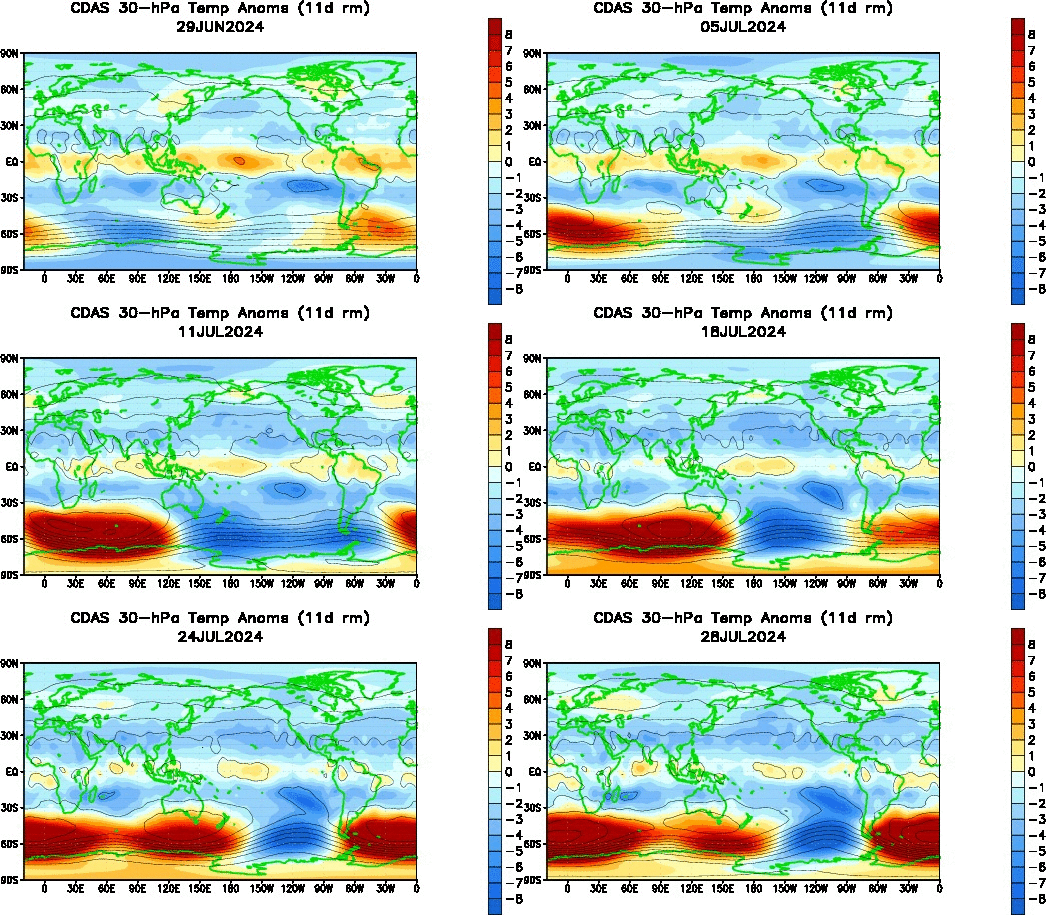
An animation of 30 millibar temperature anomalies high up in the stratosphere suggest above normal anomalies in eastern Asia, combined with a shifting body of warmth to the east from Europe will provide a base for what is expected to be a sudden stratospheric warming event. As both masses of warmth in northern Asia and southeast Asia intensify, it is expected that they will combine, and possibly push northeast into the Bering Sea to provide a base for this SSW.

Mountain torque (MT) values around the 40N parallel are beginning to spike in coordination with this warmth in the upper stratosphere. Without getting too technical, it has been seen that above normal mountain torque anomalies come around when a sudden stratospheric warming event is immenint. I circled the spike in anomalies in black on the top panel to better highlight it. Taking a look back at the animation at the top of the post, we see this warming event is beginning around the 40N parallel, so it is no wonder we are seeing MT values on the rise in the same parallel region.

The ECMWF model projects this event to reach its peak in about five days, when the maximum strength of the Wave 2 event occurs. 


Now, there are two main types of stratospheric events that disturb or split the polar vortex. There is a Wave-1 response, which involves the polar vortex becoming elongated and/or weakened, however a split does not occur. This can result in displacement of the vortex out of the Arctic, but that prospect is not as likely as it is in a Wave-2 scenario. A Wave-2 stratospheric response involves the polar vortex being split into two main vortices, as the image from NASA shows above. While the temperature images show the Wave-1 and Wave-2 (top and bottom rows, respectfully) responses occur over Greenland and Eurasia, especially with the two split vortices where one vortex goes over Greenland and one goes into Eurasia, the split can lead the vortices into any land mass, not just those two regions. 

We can deduce a few things from that ECMWF forecast image. For one, it appears that the event will be enhanced mainly over the upper stratosphere, and with an unfavorable Quasi-Biennial Oscillation, I doubt the polar vortex will split from this anticipated SSW alone. Second, it looks like the event is projected to occur at the 60N parallel, which is located in Canada and northern Asia. This, if it were to come true, would indicate the sudden stratospheric warming event would have shifted north and impacted the upper latitudes. I don't see the warming event protruding into the 90N parallel, which is nearly the highest possible latitude parallel in the northern hemisphere. This means that the SSW shouldn't slice and dice the polar vortex, which is what we're expecting (not the polar vortex split, but a lack thereof).

As for what the future may hold for the stratosphere. 100 millibar eddy heat flux values have risen to normal levels after a nearly record-setting below normal stint in late November. Whether the rising heat flux continues remains in question, but such a trend would bode very well for the stratosphere, particularly later on in winter when the Quasi-Biennial Oscillation becomes more favorable for sudden stratospheric warmings.

Andrew

Friday, December 6, 2013

December 15-20 Potential Significant Winter Storm

There is a chance of a winter storm impacting the United States in the days before Christmas, and indications are it could be a big storm.

The ECMWF Ensemble mid-level geopotential height anomaly forecast places a storm system over East Asia on December 10th, as a raging high pressure system floods into the Arctic from the Bering Sea. As I have mentioned on this blog, there is a 6-10 day correlation between weather that occurs in East Asia, and weather that occurs in the United States. Therefore, with a storm projected to impact Japan on the 10th, we should keep our eyes peeled for a winter storm around the 16th through 20th.

Models have already been picking this storm threat up.

The GFS model has been quite consistent in developing a major storm system over the Plains that would the shift northeast, towards the Midwest and Ohio Valley. As the 500mb relative vorticity chart from today's 12z GFS shows, a strong storm system is projected to eject from the Plains and then shift to the north-northeast as a result of sharp ridging to the east of the storm system, as well as ridging in the Western US. These two components can combine to make for a potentially significant winter storm.

The 12z ECMWF relative vorticity forecast for the same time as the GFS image above has the energy lagging in the Southwest, but still present in the Plains and pushing east, tilting eastward as it does so. Considering the ECMWF model has been known to lag energy in the Southwest longer than it ends up being there, one could argue that the energy should be further east than the ECMWF projects it. That said, both models appear to be in decent agreement on this storm system, despite this being in the 10 day forecast range.

(Image removed for security purposes) 

The Lezak Recurring Cycle should also be playing a role here. The images above show the frontal positions and precipitation areas on October 19th on the left, with mid-level height observations on that day on the right panel. For those of you who are unfamiliar with the LRC, it is a tool developed by meteorologist Gary Lezak that, in essence, can enable forecasters to predict the overall weather pattern months in advance. The gist of the LRC involves a cycling weather pattern that develops in October and November of each year; no pattern is the same from year to year. Around mid November, the LRC begins to repeat, meaning we start to see a similar weather pattern in mid November that we saw in early October. This means that the cycling pattern has begun, and it will continue to cycle on a generally unwavering 40-60 day interval (i.e., 50 days from cycle to cycle) for the next ~10 months before it dissipates over the following summer. With this season's cycle on roughly a 57 day interval, we can extend the October 19th system 57 days out and get to December 15th, just a day shy of the projected storm. With the Lezak Recurring Cycle in play, I'm liking the chances of a winter storm in this December 15-20 timeframe.

But that's not all that is rooting for this storm system.

A Outgoing Longwave Radiation hovmoller (or time vs longitude graph) shows the evolution of an upcoming Madden-Julian Oscillation (MJO) wave, as is shown by the negative OLR anomalies (meaning enhanced convection) in the blue oval on the bottom of the graph. I put in a red arrow to point at the area where the MJO wave will be when this projected storm is expected to come through.

This graphic from the Australian Bureau of Meteorology (BOM) illustrates each MJO phase and its respective OLR anomaly. Just like the hovmoller above, blues show enhanced convection (active MJO phase) and yellows show suppressed convection. If we take a look at where I put the red arrow on the hovmoller above, and trace it to the bottom legend listing longitudes, we find that the MJO wave will be at the 150E line, and using the composite image above (which shows each MJO phase with the enhanced convection in blue), we find that convection at the 150E longitude area equates to a Phase 6 MJO.

Precipitation composites for Phases 5 and 6 during the November-December-January period shows that storms really favor the Plains, Midwest and Great Lakes during a Phase 6 MJO. Dry precipitation trends in the Southeast and West favor that ridging pattern in the Western US and Southeast US that is being depicted by both the GFS and ECMWF modeling systems. All in all, the MJO is helping out this snowstorm prospect.

To summarize:
-A potentially significant winter storm may impact the Midwest, Plains and Ohio Valley between December 15th and 20th.
-The MJO, LRC, and East Asian correlation believe that this storm system is very possible in its current track over the aforementioned areas.

Andrew