Sunday, November 9, 2014

November 8-12 Significant Snowstorm - Final Update

This is the Final Update for this significant November 8-12 snowstorm.

NWS
Winter storm watches (dark blue) and warnings (pink) have been hoisted across a swath of the Upper Midwest into the Northern Plains, as a strong storm system looks to push south into the US and create a potentially dangerous environment for those caught by surprise from this storm. Winter weather advisories (purple) have also been issued for areas where the storm will strike earlier, compared to those in the Midwest.

Tropical Tidbits
The image above shows the GFS model's forecasted total snowfall from this storm over the next 4 days. We can see how the storm is forecasted to lay down amounts near 12" in the Northern Plains, before unleashing on the Upper Midwest. The yellow swath shows amounts in excess of 18" of snow, while those brown-ish areas depict amounts close to two feet of snow. Going by this forecast, we would see the brunt of the storm strike central and northern Wisconsin, as well as the Upper Peninsula of Michigan. Significant amounts would still impact portions of Minnesota and the Dakotas, but Wisconsin would receive the heaviest totals.

Tropical Tidbits
We'll next look over the forecast from the GFS-Parallel model, the newer version of the GFS model which will replace the current model in coming months. This GFS-Parallel model is rumored to be more accurate in multiple aspects of its forecasts, and this storm looks to be its first real test. The GFS-Parallel shifts the bulk of the snow east, now slamming the Upper Peninsula of Michigan into south-central Canada with those two-foot totals. Amounts in Wisconsin would still near 24", but not as widespread as the current GFS model shows. Minnesota is also forecasted here to receive heavier snow, extending into the Dakotas as well.

Regardless of which model you're looking at, the picture is clear: this storm will bring very heavy, very early-season snow to the Upper Midwest and North Plains.

WPC
The Weather Prediction Center issues probabilistic forecasts for snowfall amounts in a given period. In the above image, we see the WPC's forecast for the likelihood of 12" of snow falling in a 24 hour period, centered around November 11th. The WPC places the likelihood at around 50%, a value that's likely to rise as we get closer to the storm's impact and confidence increases.

To summarize:

- A significant winter storm is forecasted to affect the North Plains and Upper Midwest.
- Amounts nearing 24" may be expected, especially in Wisconsin and the Upper Peninsula of Michigan.
- Preparations for this storm should begin now.

Andrew

Thursday, November 6, 2014

November 8-12 Potentially Significant Winter Storm

Model guidance is in agreement of a strong winter storm traversing the Central US. As a result, this storm's title has been upped to a 'Potentially Significant' storm.

InstantWeatherMaps
The image above shows the most recent GFS model forecast for the next 120 hours' snowfall accumulation. In this map, we see the winter storm pounding parts of northern Iowa, southern Wisconsin and northern Illinois with over 6 inches of what would likely be some rather heavy snow, before dropping 4-6 inches in most of Michigan. The GFS model is taking the furthest south track out of major guidance, and we'll discuss that later on. The point is, however, the GFS is favoring a significant storm in the Midwest.

Tropical Tidbits
Next up, we have the GFS-Parallel model. This model is the new version of the GFS, which will be implemented in coming months. It has been rumored that this new model resolves biases in the current GFS model, with more accurate forecasts. This outlook has a swath of 12-18" of snow slamming central Wisconsin into southern Minnesota, with that heavy snow also hitting Michigan. Eyeballing it, maximum accumulation totals look to be on the order of 18-20". Clearly, this model favors a further north, even stronger storm track than the GFS. Let's see what other guidance has to say.

Tropical Tidbits
It just keeps getting worse, I suppose. This is the latest GEM model forecast of snowfall over the next five-ish days. The GEM model, from the Canadian Meteorological Centre (one of the other agencies that also spells the word as 'centre'), is notorious or exaggerating snowfall forecasts, and that is well seen in the image above. Here, we see a bullseye of around 24" of snow (two feet), pounding northern Iowa into Southern Minnesota. Wisconsin sees lesser, but still impressive amounts well above the 12" benchmark. Michigan also observes plowable snow.

We've gone through three model guidance forecasts, and have come to the idea that the GFS-Parallel and GEM support a northern track, while the GFS supports a southern track. Let's throw some ensembles into the mix and see what we can see.

NCEP
This image shows the NCEP (GFS) ensemble forecast of extratropical cyclone tracks in the next handful of days, where each line shows a different track from a different ensemble member. Ignoring the mess in the East Coast, we look around Illinois and see several lines, all very spread out. These spread-out lines, indicating spread out tracks on the upcoming storm, tell us that high uncertainty still remains with this storm. Some ensemble members go south to downstate Illinois and mid-Missouri, while others stay north into southern Wisconsin. We can't really derive anything of significance from here, other than confirming that high uncertainty remains.

For my personal view of the storm, I feel there are two possibilities.

1) Model guidance has a good handle on what's going on right now. Heavy snow will hit central Wisconsin into Minnesota, with accumulations nearing 12", if not slightly more.

2) Model biases come into play, in this case the GEM and GFS-Parallel being too slow with advancing the Arctic air southward. This would push the storm southward as well, resulting in a track similar to the GFS.

For the time being, I'll side with the North Camp of models, just because the GFS seems to be on its own with the more southern track. I'll have more updates as we move closer to the storm.

Andrew 

Tuesday, November 4, 2014

Thanksgiving Potentially Significant Early-Season Snowstorm

This is the latest discussion about the possibility of a Thanksgiving early-season snowstorm. This discussion will provide a comprehensive overview of model guidance, in addition to the expected cold air influences and potential location of the storm.

Tropical Tidbits
The image above shows the ECMWF 500mb geopotential height values in color, with superimposed mean sea level pressure (MSLP) values and appropriated high/low pressure marks. In this image, valid for November 8th over the West and North Pacific basins, we see an incredibly strong extratropical storm circulating over the far western Aleutian Islands, with a minimum SLP value of 923 millibars.

This has been the theme over the past few days, as the remnants of Typhoon Nuri are expected to race northeast into the Bering Sea, and undergo 'bombogenesis', or incredibly rapid strengthening (weather folk call it "bombing out" to mean a storm quickly becomes stronger), to develop into this projected 923 millibar beast. The ECMWF model has this storm located the furthest west out of all the guidance we will go over tonight. Make sure to keep an eye on placement of the low in all of these forecasts, as it will make a significant difference on where this resultant storm may end up.

Tropical Tidbits
We'll move now to the GFS model projection, again of 500mb geopotential height values, and superimposed MSLP forecasts. These two parameters will show up on the remainder of model guidance, to keep things as simplistic as possible. In the GFS forecast, valid for the same November 8th timeframe, we find the storm placed substantially east of the ECMWF outlook, and with a minimum SLP value of 924 millibars.

A brief background on why we're focusing on the Bering Sea so much here: The potential for a significant winter storm evolves out of the Bering Sea for this forecast. The method, referred to as the Bering Sea Rule, takes the occurrence of high and low pressure events in the Bering Sea, and expects a similar weather phenomenon to occur in the US about 17-21 days later. This is almost exactly like the Typhoon Rule I commonly discuss when analyzing winter storm potentials, except now the area to watch is the Bering Sea, and the timeframe from occurrence in the Bering Sea to reciprocation in the US is now 17-21 days. Therefore, if we take the storm in the image above (valid on 11/8) and extrapolate it out using the BSR guidelines, we come up with a potentially significant storm in the November 25-29 period, give or take a day or two. 

We can see the theme of a low 920s millibar storm hitting the Bering Sea, so let's keep pushing ahead.

Tropical Tidbits
Next up, we'll examine the GFS-Parallel forecast. This is the model expected to succeed the current GFS model, with higher resolution and corrected model biases. This model shows the Bering Sea storm bottoming out at 919 millibars, the strongest forecast of the three observed thus far. This storm appears to be a combination of the ECMWF and GFS models; you can click on one and move back and forth between images to get a sense for such a shift.

We've evaluated three major models thus far, all of which combine for a mere five millibar spread (minimum 919mb to maximum 924mb). We can now see confidence greatly rising in this potential for a very strong storm to hit the Bering Sea; let's see if ensemble guidance agrees.

Tropical Tidbits
Moving ahead to the ensembles, first and foremost the ECMWF Ensembles, we find the average of all 52 members - yes, that's fifty-two individual ensemble members - to place this storm at a strength of 938 millibars. With the storm only 96 hours away from entering the Bering Sea, and ensemble guidance continuing to strengthen with time, confidence only rises in this possibility of a near-record-breaking extratropical cyclone to strike the Bering Sea. 

As a side note, notice how the ECMWF ensembles are slightly east of the ECMWF model itself. We'll discuss this more later on.

Tropical Tidbits
Finally, we'll take a look at the Canadian GEM ensembles. The GEM model itself was unavailable for use in this post, so we'll use the ensembles as the next-best-thing, if not the best thing. The GEM ensembles show the average of all ensembles (around 22 individual members, if I recall correctly) to be slightly east of the ECMWF ensembles, with a mean strength of 948 millibars to be the weakest with this storm out of all global guidance. 

So, now that we've evaluated all model guidance available at the time of posting, let's summarize a few things to take away.
- Major operational model guidance is down to a consensus that the storm will likely land somewhere around 920 millibars in strength. That's a VERY strong storm.
- Ensemble guidance is still in disagreement, but does find a conclusion that there will be a strong storm in the Bering Sea for this timeframe.

I said I would discuss why location is key in the models, so let's quickly discuss. From the team at KOPN, it appears that weather in the Shemya Island region of the Aleutian Islands correlates roughly to weather in north-Central Missouri. Thus, one could believe that a storm northwest of Shemya would see a storm in the Plains, a storm south of Shemya might see a Texas storm system, etc. 

Google
The pinpoint above shows the location of Shemya, Alaska. Doing a quick visual comparison to the five model guidance graphics we went over earlier in this post, but also remembering this location correlation is NOT proven quite yet (as of now, it's interpreted to act as a guideline), this Bering Sea storm would likely correlate to a powerful storm in the Upper Midwest, Plains, Midwest, Great Lakes, Canada... this particular correlation method is not an exact science, and should not be interpreted as such. Hence why it's only a guideline for now

But we're not just watching for a powerful winter storm- we're watching for potentially significant cold!

CPC
The animation above shows temperature anomalies at the 10 millibar level, in the far upper reaches of the stratosphere, over the past month or so. According to this animation, we recently saw a very early stratospheric warming event overtake the Eurasia and North Pacific basin. If we remember that the warmth in the stratosphere typically results in very cold weather at the surface about 2-4 weeks later... put the pieces together, and we could very well see a strong body of cold air intercept this potentially significant winter storm system, making for one heck of a situation that could unfold.

Let's summarize all of this.

- Confidence is growing in the threat of a near-record-breaking extratropical storm system impacting the Bering Sea.
- If this forecast goes as planned, a powerful storm system would be expected to traverse North America around or just after Thanksgiving.
- Abundant cold air provided by the stratospheric warming may enable a larger threat of snow, if such a threat does evolve.
- A high amount of uncertainty still exists with this storm potential, hence the continued caveat-laced language in these posts.

Andrew 

November 8-12 Potential Winter Storm

Model guidance appears to be toying with the idea of a winter storm in the November 8th-12th timeframe.

Tropical Tidbits
The image above shows the ECMWF model's forecast of mean sea level pressure (MSLP) contours and 850mb temperature values, valid for November 11th of next week. In this image, we see a strong storm system pushing north into western Illinois, dragging down sub-freezing air behind it only a few thousand feet off the ground. This 995 millibar storm would bring predominantly snow to areas north of the thin red freezing line, which would include Wisconsin and Iowa, among other regions.

I cannot post graphics due to copyright concerns, but this ECMWF run spits out over 12" of snow in parts of Wisconsin due to this storm. The ECMWF has shown this storm inconsistently for a few runs now, keeping uncertainty high.

Tropical Tidbits
The image above shows the GFS-Parallel model's forecast of MSLP values and 500 millibar geopotential height values, valid on November 10th. In this image, we see a messy set-up for this storm, with one low pressure system located in northwest Missouri, apparently attached to a very weak low pressure system in Michigan. This set-up would likely keep most snow out of the picture, save for the Upper Midwest, and is a plausible solution, given that this model will succeed the GFS model in due time.

This whole potential for a winter storm arises from what we saw happen in Japan a few days back.

PSU
The above image shows observed 500 millibar geopotential height anomalies over the Northern Hemisphere (left panel), as well as cloud cover and high/low pressure demarcations (right panel). Note how we saw a very strong storm stirring up near Japan on this date, which was November 2nd. We saw a strong trough wrap up and occlude just north of Japan, still bringing through a respectable shot of cold air. I had discussed earlier about how this could provide the basis for a potential winter storm, and it appears that this potential is being realized now.

Because this storm appears to occlude north of Japan, but still scrape the western side of the nation as it does so, I'm still content believing the risk for a winter storm remains. Just how great that risk is must be examined further, but the chance remains.

To summarize:

- Model guidance is indicating the potential for a winter storm to hit the Central US in the next week or so.
- Very high uncertainty exists with this storm potential.
- Depending on cold air availability, as well as if the storm actually happens, accumulating snowfall may be a concern.

Andrew

Monday, November 3, 2014

Thanksgiving Potentially Significant Winter Storm

This is an update to yesterday's post, discussing a potentially significant winter storm in the November 24-30 timeframe.

Tropical Tidbits
The image above shows the ECMWF 500mb geopotential height values in color, with superimposed mean sea level pressure (MSLP) values and appropriated high/low pressure marks. In this image, valid for November 8th over the West and North Pacific basins, we see an incredibly strong extratropical storm circulating over the far western Aleutian Islands, with a minimum SLP value of 920 millibars.

To give you an idea of how strong this reading is, if this forecast from the most prestigious weather model in the world were to verify, we could very well break the record for the lowest extratropical minimum SLP value ever recorded (the lowest SLP value ever belongs to Typhoon Tip, with 870 millibars, but that was a tropical system). But the most intriguing thing?

It could actually happen.

This whole process looks to begin with the remnants of Typhoon Nuri, currently offshore Japan, which will race northeast and quickly strengthen as it approaches the Bering Sea. While storm systems tend to strengthen in the Bering Sea, this one may strengthen much faster and even stronger than most due to that tropical component from Typhoon Nuri.

But wait! Why should we care about this? What about the Thanksgiving storm? The potential for a significant winter storm evolves out of the Bering Sea for this forecast. The method, referred to as the Bering Sea Rule, takes the occurrence of high and low pressure events in the Bering Sea, and expects a similar weather phenomenon to occur in the US about 17-21 days later. This is almost exactly like the Typhoon Rule I commonly discuss when analyzing winter storm potentials, except now the area to watch is the Bering Sea, and the timeframe from occurrence in the Bering Sea to reciprocation in the US is now 17-21 days. Therefore, if we take the storm in the image above (valid on 11/8) and extrapolate it out using the BSR guidelines, we come up with a potentially significant storm in the November 25-29 period, give or take a day or two.

Tropical Tidbits
This next graphic above shows the same 500mb height values and superimposed MSLP values over the West Pacific, like the ECMWF model forecast, but now from a different model. This is the GFS-Parallel model, rumored to be the next-generation forecasting model that will soon replace the GFS model. For the time being, this is an experimental model, and won't become operational for another month or two, but it's still worth using for examination purposes.

Here, we see in this forecast for November 8th, the minimum SLP is down to 914 millibars. That's about 6 millibars stronger than the ECMWF forecast, and indicative of a likely-record-breaking storm, but the premise remains the same. Both model guidance systems are showing a very strong storm system in the Bering Sea in this November 8th timeframe. If you're a true analyst, you might notice that the GFS-parallel forecast is just a bit east of the ECMWF forecast. That does make a difference in this forecast, and I'll explain it a bit later in this post.

Tropical Tidbits
In the spirit of including the old with the new, we'll go over the currently-operational GFS model and its forecast. Here, we see the projection for November 8th calls for a 923 millibar cyclone to hit the Bering Sea. This is the weakest of the three forecasts we've analyzed thus far, but that's a pretty odd thing to say when the weakest member of the three is "only" at 923 millibars. Despite the slightly weaker outlook, the consensus is still for a very strong, possibly record-breaking storm to hit the western Bering Sea.

Tropical Tidbits
Lastly, to show I'm willing to include all angles and not, as some may accuse, only the strongest projections, we'll go over the ECMWF ensemble set. The ECMWF ensembles, commonly called the most accurate ensemble set in the world at this time, are forecasting a minimum SLP of 947 millibars for this storm system on November 8th.

If you aren't sure how to interpret this, I'll sum it up: WOW!

Ensemble guidance is composed of a number of 'members', or versions of the original model that have been slightly altered, intentionally, to produce a 'spread', or variation, in the forecast. This then adds accuracy to the forecast. It's very surprising to see a set of ensembles - from the ECMWF, no less - to be calling for a 945mb storm to strike the Bering Sea. This average of 52 - yes, fifty-two separate ensemble members - indicates that certainty for such a strong storm to hit the north Pacific is on the rise. It's quite plausible we see this minimum SLP from the ECMWF ensembles drop in future runs.

But we're not just watching for a powerful winter storm- we're watching for potentially significant cold!
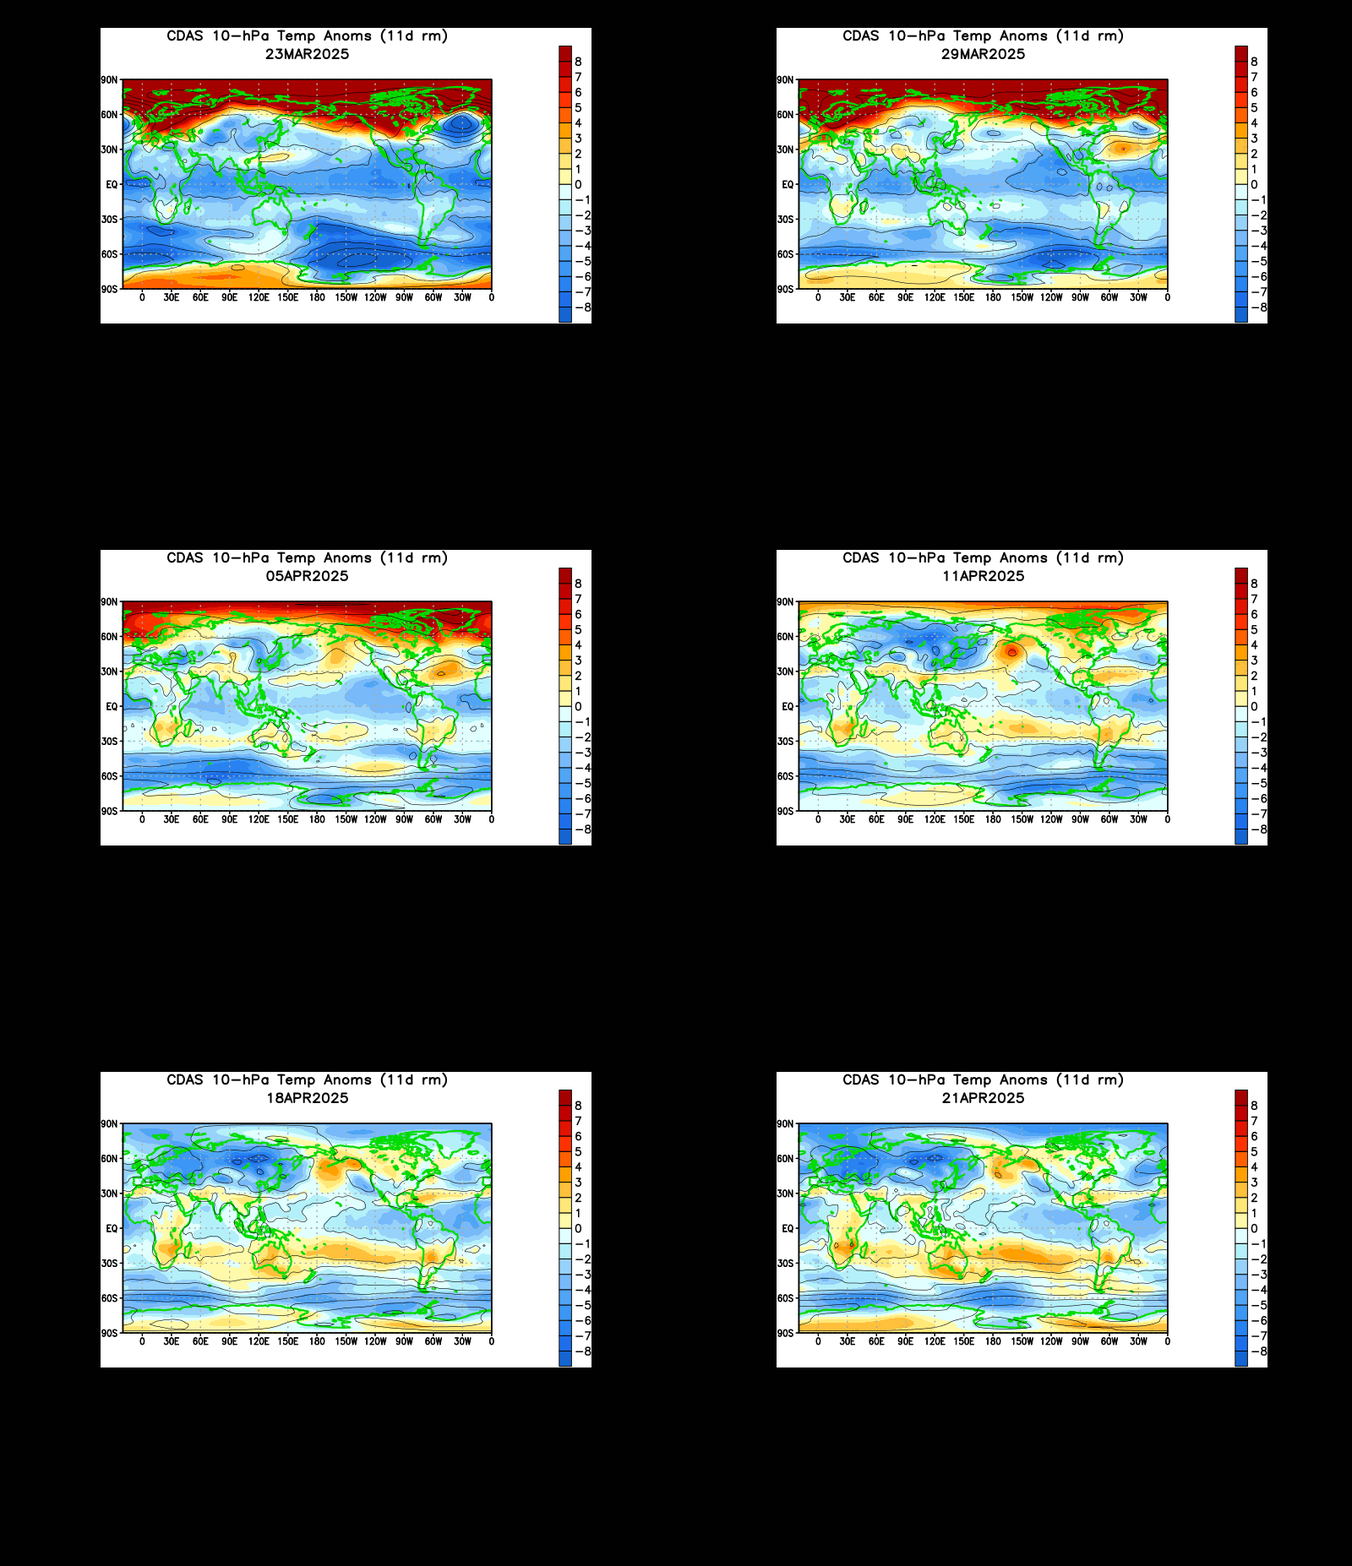
CPC
The animation above shows temperature anomalies at the 10 millibar level, in the far upper reaches of the stratosphere, over the past month or so. According to this animation, we recently saw a very early stratospheric warming event overtake the Eurasia and North Pacific basin. If we remember that the warmth in the stratosphere typically results in very cold weather at the surface about 2-4 weeks later... put the pieces together, and we could very well see a strong body of cold air intercept this potentially significant winter storm system, making for one heck of a situation that could unfold.

You might have noticed a combination of rather ominous language about the storm, as well as more than a few caveats. Both are well warranted, as we'll have to wait and see if this storm ends up being as strong as projected in the Bering Sea.

To summarize:

- The potential exists for a significant winter storm around Thanksgiving.
- With stratospheric-induced cold air possibly intercepting this storm, winter weather may be a serious issue to contend with.
- High uncertainty still exists, but appears to slowly be waning.
- As of now, the Central and East US look to be affected by this storm (i.e. Midwest, Great Lakes, Ohio Valley, Northeast...).

Andrew